

Does your marketing strategy actually drive profit, or is it simply feeding the dominance of Online Travel Agencies? In 2026, relying on generic saas marketing analytics benchmarks is a liability for hospitality leaders who must protect their margins from rising acquisition costs. You likely feel the daily friction of fragmented data sitting across your PMS, POS, and CRM systems, making it nearly impossible to measure true multi-channel ROI. It's a common frustration to see bookings rise while your net revenue stays stagnant due to hidden commission leaks.
This guide provides the clarity you need to transform chaotic data into a streamlined commercial engine. You'll discover the essential 2026 performance targets required to reduce acquisition costs and reclaim your direct booking share. We provide a rigorous framework for optimising your spend and the evidence needed to secure budget requests for AI-driven analytics. From understanding the shift toward net acquisition efficiency to mastering predictive modelling, here is how you'll lead your organisation to a more profitable year.
Key Takeaways
- Understand how 2026 saas marketing analytics benchmarks have evolved to prioritise net acquisition efficiency and profit margins over surface-level metrics.
- Define success using hospitality-specific targets for CAC and ROAS that account for the unique pressures of OTA commissions and guest lifecycle value.
- Discover how to consolidate fragmented data from PMS and booking engines to build a unified, high-level perspective of your commercial performance.
- Compare your current performance against 2026 industry standards for hospitality commercial models to identify specific areas for budget optimisation.
- Learn how to leverage predictive modelling and growth recommendations to achieve measurable results, such as a 15.3% reduction in guest acquisition costs.
Why SaaS Marketing Analytics Benchmarks Have Shifted in 2026
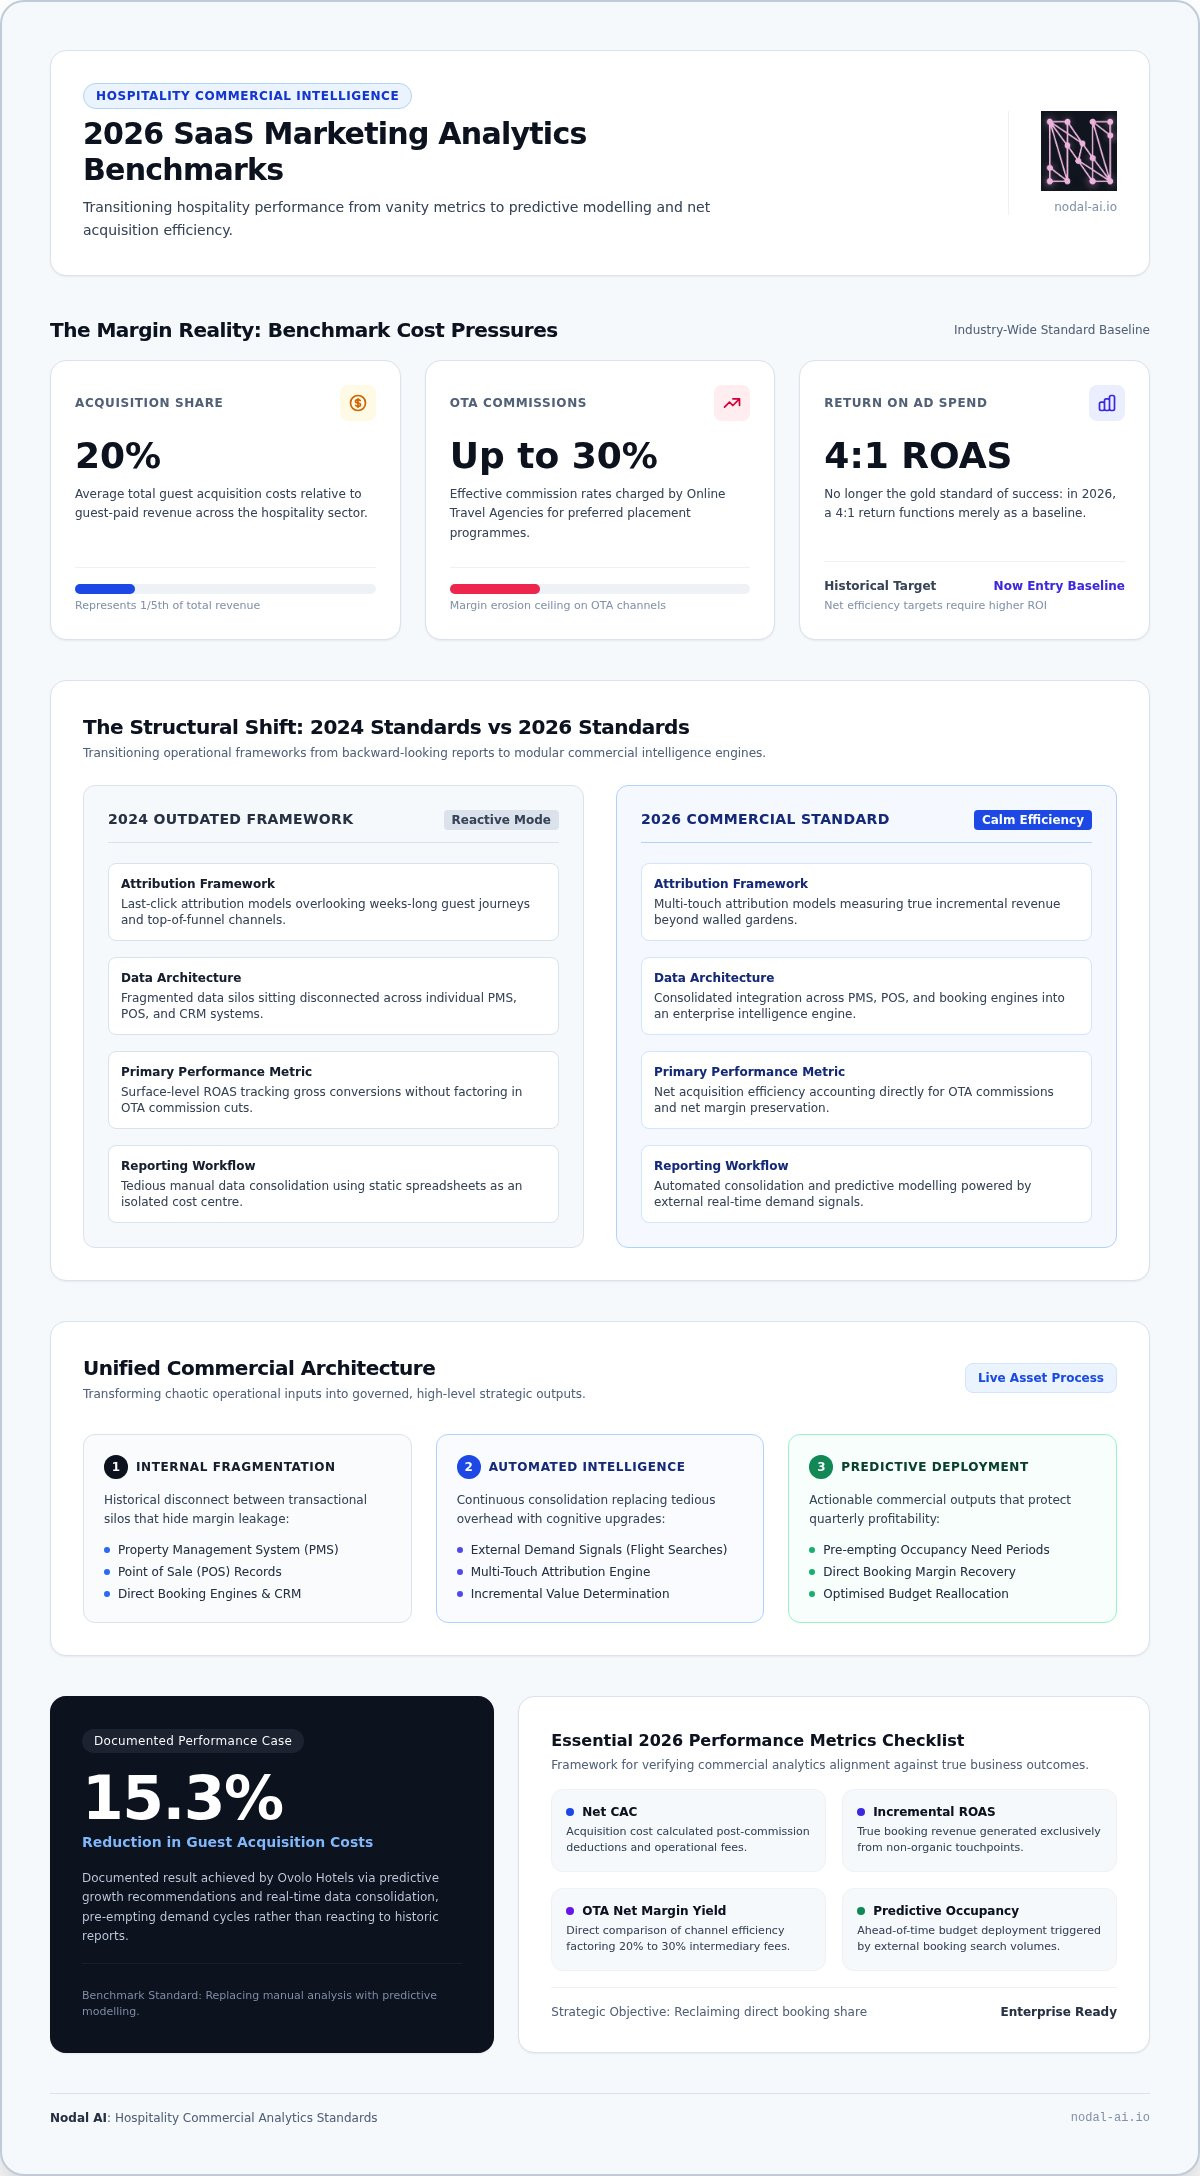
In 2026, the definition of success has moved beyond static spreadsheets. For hospitality leaders, saas marketing analytics benchmarks now represent the pulse of commercial intelligence rather than just a backward-looking report. Traditionally, benchmarks served as a simple comparison tool. Today, they function as a modular intelligence engine that bridges the gap between fragmented data silos and actionable growth. By adopting best practice benchmarking methods, teams can transform chaotic inputs from PMS and POS systems into high-value outputs that protect margins. Total guest acquisition costs now represent an average of 20% of guest-paid revenue across the sector; mastering these benchmarks is the only way to lower that figure and reclaim your profitability.
The shift is driven by a fundamental change in how we perceive performance. In previous cycles, marketing was often treated as an isolated cost centre. Now, integrated systems and automated processes have tethered every pound spent to concrete business outcomes. We've moved from reactive reporting to a state of calm efficiency where predictive modelling sets the pace for quarterly targets. Data is no longer a static record; it is a live asset that should actively participate in your business process. Stop guessing and start governing your growth with a high-level perspective that identifies exactly where your budget is working hardest.
This transition from "what happened" to "what will happen" is the hallmark of a cognitive upgrade for your entire organisation. Leaders who continue to rely on 2024 standards find themselves trapped by rising acquisition costs and OTA dominance. Conversely, those who embrace the 2026 standard of saas marketing analytics benchmarks use transparency to remove ambiguity. They replace the anxiety of manual, tedious tasks with the confidence of streamlined, enterprise-ready insights. This evolution ensures that your marketing engine isn't just running, but is actively optimised for long-term stability and measurable returns.
The Death of Last-Click Attribution
Relying on last-click attribution in 2026 is a recipe for margin erosion. This outdated model fails to account for the complex guest journey that often starts weeks before a booking. Modern benchmarks prioritise multi-touch attribution to value top-of-funnel channels accurately. Rather than just tracking gross conversions, leaders now measure incremental revenue. This shift allows brands to look beyond the walled gardens of Meta and Google to identify where true value is created. It helps reduce the heavy reliance on OTAs, where effective commission rates often reach 30% for preferred placement programmes.
AI-Powered Efficiency Standards
Automation has redefined the manual labour overhead of the modern marketing team. Automated reporting now handles the tedious task of data consolidation, allowing professionals to focus on high-level strategy. This isn't just about speed; it is about the cognitive upgrade that real-time data provides. Predictive modelling allows teams to pre-empt occupancy need periods by integrating external demand signals like flight search volumes. By moving toward predictive growth recommendations, brands can achieve results like the 15.3% reduction in acquisition costs seen by Ovolo Hotels. Real-time data consolidation is now a prerequisite for accurate benchmarking.
Core Metrics: Defining Success in Hospitality Performance Marketing
Measuring success in 2026 requires a shift from vanity metrics to commercial intelligence. Traditional saas marketing analytics benchmarks often fall short because they fail to account for the unique data fragmentation within the hospitality sector. You must move beyond surface-level figures to understand the true cost of every guest. By integrating your PMS and POS data, you transform passive figures into active participants in your growth strategy. This clarity replaces the anxiety of rising costs with the confidence of high-level, streamlined perspectives.
Many leaders struggle because their analytics don't align with actual business performance. This disconnect is a common pitfall highlighted in Harvard Business Review research on marketing analytics effectiveness, which suggests that failing to tether metrics to quantifiable outcomes leads to wasted spend. In 2026, a 4:1 ROAS is no longer the gold standard; it is merely a baseline. You should aim for a net acquisition efficiency that accounts for OTA commissions and payment fees. This transition from gross revenue to net profit ensures long-term stability for your organisation.
Recalculating CAC for the Hospitality Sector
Customer Acquisition Cost (CAC) must be more than just your total ad spend divided by new bookings. In 2026, an accurate CAC includes loyalty programme overheads, retention efforts, and even the impact of staff service quality on acquisition efficiency. Total guest acquisition costs now represent an average of 20% of guest-paid revenue across the sector. Direct bookings typically average an all-in acquisition cost between 4.0% and 5.0% of booking value. Compare this to effective OTA rates that often sit between 25% and 30% when visibility boosters are included. You can explore modular intelligence features to identify exactly where your direct spend is outperforming third-party channels.
LTV and Ancillary Revenue Benchmarks
Lifetime Value (LTV) is the ultimate metric for sustainable growth. Direct hotel reservations produce an average of $519 in gross revenue compared to $320 for OTA reservations; this means direct guests generate 62% higher initial revenue. Beyond the first stay, direct bookers demonstrate a repeat visit rate that is 2.1 to 3.4 times higher than those from third-party platforms. Benchmarking should include ancillary spend across spa, wellness, and F&B to capture the full guest lifecycle. By focusing on these high-propensity segments, you can move from reactive reporting to a predictive model that suppresses low-margin audiences and prioritises high-value guests.
2026 Benchmarks: Hospitality SaaS vs General B2B Standards
Generic saas marketing analytics benchmarks are often a liability for hospitality leaders. While enterprise software companies rely on predictable monthly recurring revenue, hospitality models must navigate the volatility of occupancy and transactional booking cycles. According to SaaS performance and marketing efficiency benchmarks, the "Rule of 40" remains a core health indicator for software firms; however, hospitality commercial intelligence requires a more nuanced approach. In 2026, marketing spend as a percentage of revenue is shifting as leaders move away from high-commission OTAs toward direct digital engines. While a general B2B SaaS firm might allocate 40% of revenue to growth, hospitality operators find success by capping total guest acquisition costs at 20% while prioritising direct channel contributions.
Volatility is the primary differentiator. External signals such as foreign exchange movements, weather anomalies, and local events impact hospitality benchmarks in ways that B2B SaaS never experiences. A sudden shift in flight search volumes can render last month's conversion targets obsolete within days. To maintain a high-level perspective, your analytics must transform these external signals into active participants in your business process. This cognitive upgrade allows you to pre-empt occupancy need periods rather than reacting after your numbers drop. It replaces the anxiety of unpredictable markets with the confidence of future-facing, streamlined intelligence.
Hospitality-Specific Performance Targets
Success looks different across your portfolio. For upscale F&B and QSR models, current ROAS benchmarks have climbed as hyper-localised AI targeting suppresses low-margin audiences. In the serviced apartment and hostel sectors, booking conversion rates now standardise between 2.2% and 3.9%, though optimised boutique properties often exceed 5.0%. Private members' clubs and wellness centres should look for member retention rates that mirror the high stickiness of B2B software, often exceeding 90% annually. These targets are not static; they are the baseline for your commercial engine.
Why General SaaS Benchmarks Often Mislead
Relying on software subscription data to manage a hotel booking engine is a fundamental error. B2B SaaS cycles are long and stable, but hospitality lead times have contracted significantly. In 2026, average booking windows sit between 15 and 25 days, with last-minute reservations (those made within six days of arrival) representing up to 35% of all bookings. Seasonality also injects a level of data volatility that general SaaS models don't experience. High-margin luxury brands specifically must avoid "average" industry data that conceals the premium guest's unique journey. If you need to see how your specific model stacks up, you can book a demo to view tailored intelligence.
How to Benchmark Your Data Against Industry Leaders
Transforming raw data into a competitive advantage requires a structured, multi-step journey. You cannot simply look at a dashboard and hope for clarity; you must actively govern your inputs to extract high-value outputs. By following these steps, you align your performance with the most rigorous saas marketing analytics benchmarks of 2026. This process replaces the anxiety of manual reporting with the confidence of a streamlined commercial engine that identifies exactly where your profit is generated.
First, consolidate your fragmented data. Your PMS, POS, and booking engines are currently passive silos that hide your true margin. Centralise these sources into a single view to eliminate the disconnect between marketing spend and guest revenue. Second, implement a multi-touch attribution model. This identifies high-value channels that traditional last-click models ignore, ensuring you don't overspend on low-margin OTA traffic that erodes your bottom line.
Solving the Data Fragmentation Problem
A single view of the customer is essential for accurate benchmarking. Integrating legacy systems like Oracle OPERA with modern platforms like Mews or Cloudbeds often reveals deep-seated data discrepancies that skew your results. These pitfalls can distort your CAC and LTV figures if not managed through strong data governance. Maintain benchmark integrity by ensuring every guest touchpoint is captured and cleaned in real time. This transparency serves as a cognitive upgrade for your entire commercial team.
Third, normalise your data by accounting for external volatility. In 2026, your internal trends must be viewed through the lens of flight demand, weather anomalies, and FX rates. Fourth, compare these normalised internal trends against industry averages to see where you are overperforming. Finally, use predictive insights to adjust your spend before occupancy "need periods" occur. This moves your strategy from reactive survival to proactive growth, allowing you to capture demand before your competitors realise it exists.
Incorporating External Signals
Local events and tourism trends shift your saas marketing analytics benchmarks overnight. If flight search volumes to your region drop by 10%, your conversion targets must adjust accordingly to remain realistic and protect your ROAS. FX rates also play a critical role in international guest acquisition; a weakening currency may increase the CAC for specific global travellers while making your property more attractive to others. Nodal AI automates the integration of these complex data points, turning external chaos into a streamlined perspective for your team.
Book a demo to automate your benchmarking
Beyond Benchmarks: Using Nodal AI to Outperform the Market
Benchmarks provide the baseline, but outperforming the market requires a cognitive upgrade for your commercial team. While standard saas marketing analytics benchmarks tell you where you stand, Nodal AI tells you where to go. It transforms passive data into a high-value growth engine; it replaces the anxiety of manual reporting with the confidence of automated, high-level perspectives. By moving from "what happened" to "what to do," you reclaim control over your margins and reduce the friction caused by fragmented systems. This transition ensures your technology isn't just a functional tool, but a visionary partner in your success.
The results are measurable and immediate. Implementation of the Nodal Platform delivered a 15.3% reduction in acquisition costs for Ovolo Hotels, alongside a 24.5% lift in Return on Ad Spend (ROAS). These aren't just incremental gains; they represent a fundamental shift in commercial efficiency. By leveraging AI-driven audience segmentation, you can suppress low-margin audiences and re-allocate your budget toward direct booking channels. This level of precision allows you to outperform generic saas marketing analytics benchmarks by focusing on the high-propensity guests who drive long-term stability.
Connecting the Dots with the Nodal Platform
Our modular architecture supports Operational, Demand, and Guest modules to bridge every gap in your tech stack. This integrated approach ensures that your PMS, POS, and CRM data work together to reduce OTA leakage. You can book a demo to see your data in action and discover how a single view of the customer simplifies complex decision-making. Stop fighting your data and start using it to drive direct revenue through a cognitive upgrade of your entire organisation.
Predictive Modelling for Scalable Growth
Predictive modelling allows you to identify churn risk in membership models before it impacts your bottom line. For hostels and serviced apartments, understanding how stay extensions and ancillary spend affect bed yield is critical for scaling. Nodal AI closes the loop by turning benchmarks into actionable commercial intelligence. It allows you to pre-empt occupancy need periods with precision, ensuring your organisation remains competitive and forward-thinking in a volatile 2026 market. This is how you move beyond surviving the industry standard to setting it yourself.
Mastering the Future of Hospitality Intelligence
Mastering saas marketing analytics benchmarks in 2026 is about more than just matching industry averages; it is about building a cognitive upgrade for your entire commercial operation. You have seen how consolidating fragmented data from PMS and booking engines turns passive assets into active profit drivers. By moving from reactive reporting to predictive modelling, you replace the anxiety of margin erosion with the confidence of streamlined growth. This transition ensures that your marketing engine isn't just running, but is actively optimised for long-term stability.
The evidence for this shift is clear. Brands that bridge these data silos achieve measurable returns, including a 15.3% reduction in acquisition costs and a 24.5% increase in ROAS. This approach is not just effective; it is award-winning, as demonstrated by our Gold at the Performance Marketing Awards. You now have the framework to reduce OTA leakage and reclaim your direct booking share with total transparency.
Book a personalised Nodal AI demo
Your journey toward total clarity and superior commercial performance starts now. Take the first step toward transforming your fragmented data into a visionary growth engine today.
Frequently Asked Questions
What is a good ROAS for hospitality marketing in 2026?
A good ROAS in 2026 is one that exceeds a 4:1 ratio, though market leaders now target net acquisition efficiency rather than gross figures. For upscale F&B and boutique properties, achieving a 24.5% increase in ROAS is possible through AI-driven optimisation. You should focus on reducing OTA commissions, which often reach 25% or more, to ensure your blended ROAS reflects true profitability rather than surface-level revenue.
How does Nodal AI differ from traditional marketing analytics tools?
Nodal AI differs from traditional tools by consolidating fragmented data across PMS, POS, and CRM systems into a single view. While standard platforms offer siloed reporting, Nodal AI uses a modular intelligence engine to turn chaotic inputs into high-value growth recommendations. It integrates external signals such as weather, FX rates, and flight demand, providing a cognitive upgrade that moves beyond "what happened" to "what to do."
Why are SaaS marketing benchmarks different for the hospitality industry?
Hospitality saas marketing analytics benchmarks must account for transactional booking cycles and occupancy volatility rather than just steady subscription revenue. Unlike generic B2B software, hospitality models face high-commission third-party distribution and shortened booking windows, which now average 15 to 25 days. Seasonality and external demand signals create a level of complexity that generic benchmarks ignore, making industry-specific metrics essential for accurate commercial intelligence.
What is the average CAC for a luxury hotel brand in 2026?
The average CAC for a luxury brand in 2026 typically sits between 4% and 5% of the booking value for direct channels. However, total guest acquisition costs often reach 20% of revenue when accounting for OTA dependencies. Successful luxury leaders use predictive modelling to identify high-propensity segments, effectively reducing spend on low-margin audiences while increasing the lifetime value of direct bookers who generate 62% higher initial revenue.
Can I use these benchmarks for my QSR or restaurant business?
Yes, these benchmarks are highly applicable to QSR and upscale F&B businesses looking to measure footfall and revenue across multiple locations. You can use these standards to understand how your delivery versus dine-in mix affects your overall margins. By tracking repeat visits and average spend per head, you transform passive transactional data into active participants in your commercial growth strategy, ensuring your organisation remains competitive.
How does multi-touch attribution affect my marketing benchmarks?
Multi-touch attribution provides a high-level perspective of the guest journey, ensuring you don't overvalue last-click channels like OTAs. It identifies the true impact of top-of-funnel awareness campaigns on final direct bookings. By implementing this model, you replace the anxiety of misallocated spend with the confidence that every marketing pound is contributing to incremental revenue. This clarity is essential for any modern saas marketing analytics benchmarks strategy.
What data sources do I need to integrate for accurate benchmarking?
Accurate benchmarking requires integrating operational systems like Oracle OPERA or Mews with transactional platforms such as Synxis or SevenRooms. You should also connect guest data from CRM systems like Revinate alongside demand signals from Google Ads and Meta. Consolidating these disparate sources into a single view is the only way to overcome the data fragmentation that currently erodes your profit margins and hides your true performance.
How often should we review our marketing performance benchmarks?
You should review your performance benchmarks in real time through automated reporting to react to contracting booking windows. In 2026, waiting for a monthly report means missing urgent, last-minute booking trends that represent up to 35% of all reservations. Continuous monitoring allows you to pre-empt occupancy need periods and adjust your spend before your competitors realise a shift in demand has occurred, keeping your organisation ahead.


