

Last-click can claim all the credit while overlooking the interactions that helped make a sale possible. Marketing attribution assigns value to customer touchpoints before a purchase; algorithmic attribution modeling, explained in practical terms, uses data and machine learning to distribute that credit. The result is a more complete view of how different channels contribute, though no model tells the whole story.
Marketing data should clarify how customers make decisions, not add another layer of confusing numbers. This article explains how algorithmic attribution differs from first-click, last-click and rule-based approaches, and what to consider when comparing models. You’ll see how a model’s assumptions shape its credit allocation, why customer journeys and business goals matter, and how to choose an approach that makes performance easier to interpret.
Key Takeaways
- Compare how each model assigns credit, from single-touch rules to data-driven analysis, before using its results to guide spend.
- Match the model to your customer journey: position-based attribution highlights key moments, while other multi-touch approaches distribute credit differently.
- Use custom attribution when your business goals call for a tailored view, and make sure the model reflects reliable customer journey data.
- Choose a simple single-touch model when it suits your buying cycle, but remember it leaves other interactions out of the credit calculation.
- Review model outputs alongside sales insights to understand which channels help move customers towards conversion.
What is marketing attribution modelling?
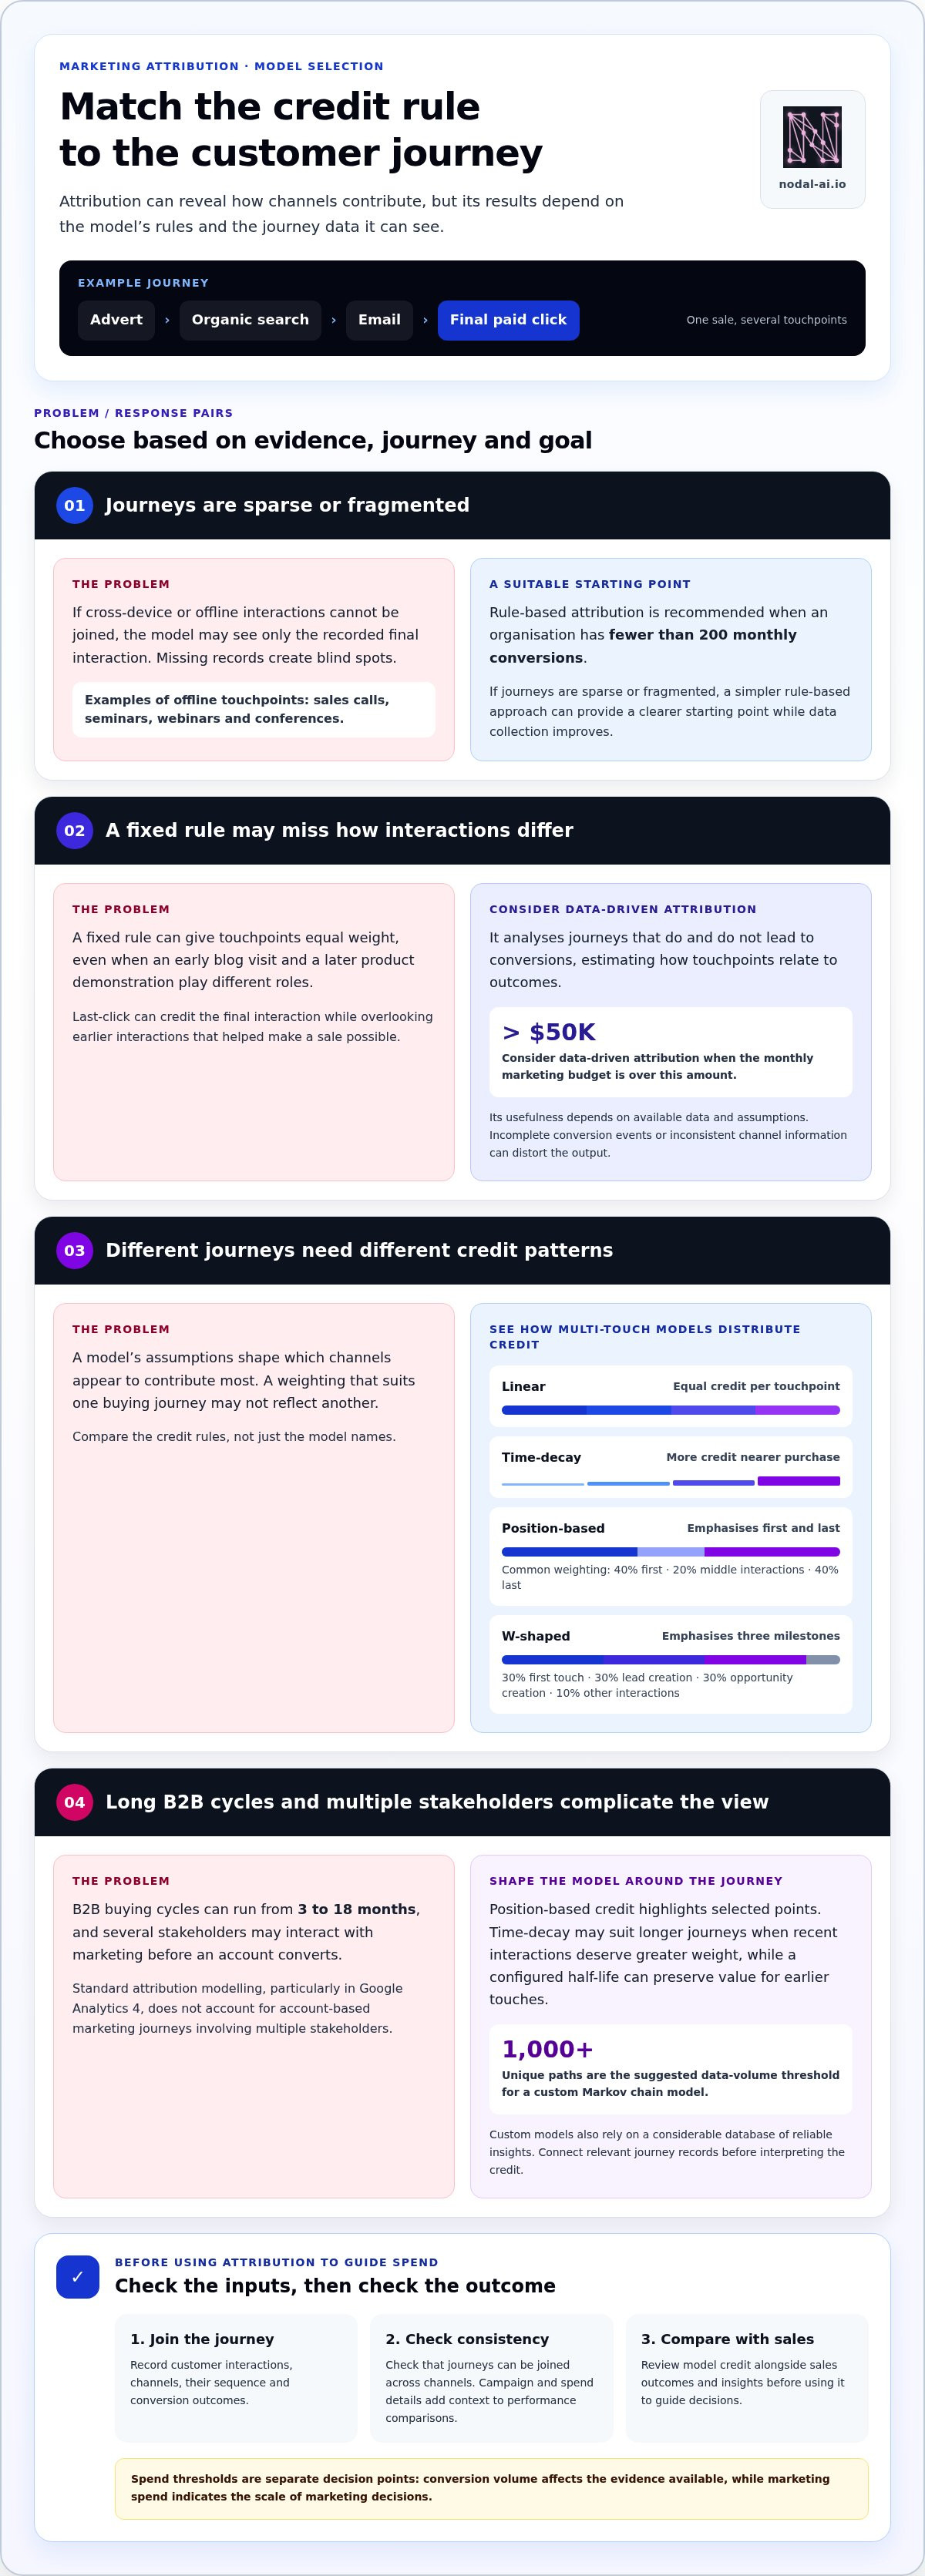
Marketing attribution modelling assigns credit to customer interactions before a purchase. For example, a customer journey might include an advert, organic search, an email and a final paid click.
What data is needed? A model needs recorded customer interactions, their channels and sequence, and conversion outcomes. Campaign and spend details add context when you compare marketing performance.
How do you implement algorithmic attribution modelling? Connect interaction and conversion data, check that journeys can be joined across channels, then apply a model to estimate each touchpoint’s contribution. Compare the resulting credit with sales outcomes before using it to guide decisions.
Data-Driven Credit Assignment
Data-driven attribution uses observed customer journeys to distribute conversion credit according to each interaction’s contribution. Unlike a fixed rule that gives every touchpoint equal weight, it can distinguish between an early blog visit and a later product demonstration. This helps teams understand which interactions assist conversions, not just which one happened last.
For example, if customers who convert often view a case study before requesting a demonstration, the model can account for that pattern when calculating credit. Its output depends on the available data and assumptions, so missing journeys can change the picture.
Machine Learning in Attribution
Machine learning analyses patterns across journeys that do and do not lead to conversions, estimating how touchpoints relate to outcomes. The model learns from available data and adjusts its credit estimates as it processes interactions. This can reveal patterns a preset rule may overlook, giving marketers a more responsive view of channel contribution.
Data-driven attribution depends on meaningful signals, such as recorded conversions and consistent channel information. If campaign labels change or conversion events are incomplete, the model receives a distorted account of the journey. Consistent inputs make its output more useful for decisions.
Data Gaps and Journey Visibility
Data gaps arise when interactions cannot be connected into a complete customer journey, including cross-device behaviour or offline activity. Someone might discover a brand on mobile, research it on a laptop, then convert after speaking with sales. If those events remain separate, the model may assign credit only to the recorded final interaction.
Offline touchpoints such as sales calls, seminars, webinars and conferences can matter in B2B journeys. Connecting those records with digital activity gives a fuller view, while missing records leave blind spots. Cross-channel models can include online and offline channels, but their usefulness depends on what journey data is captured.
Choose by data volume and spend. Rule-based attribution is recommended when an organisation has fewer than 200 monthly conversions. Consider data-driven attribution when the monthly marketing budget is over $50K; behavioural multi-touch attribution is recommended for businesses spending $100K or more per month on ads. These are different decision points: conversion volume affects the evidence available, while spend indicates the scale of marketing decisions.
Custom models also rely on a considerable database of reliable insights. For a custom Markov chain model, the suggested data-volume threshold is 1,000+ unique paths. If journeys are sparse or fragmented, a simpler rule-based approach can provide a clearer starting point while data collection improves.
What is multi-touch attribution?
Multi-touch attribution shares conversion credit across several interactions rather than assigning it to one click. The model you choose affects which channels appear to contribute most.
Multi-Touch Model Types
Multi-touch models distribute credit across a customer journey using rules that reflect different marketing priorities. Linear attribution gives each touchpoint equal credit, while time-decay gives more credit to interactions closer to purchase. Position-based models prioritise selected points, and W-shaped models emphasise three milestones. Comparing these methods shows how a chosen rule can change channel performance reports.
Position-Based Credit Allocation
Position-based attribution gives extra credit to selected points, usually the first and last interactions. One common approach assigns 40% to each, then shares the remaining 20% among middle touchpoints. That can recognise both discovery and conversion-driving activity, while still crediting the interactions in between. It suits teams that value both ends of the journey, but its fixed weighting may not reflect every sales process.
W-shaped attribution adapts this logic for lead generation by assigning 30% each to the first touch, lead creation and opportunity creation. The remaining 10% is shared across other interactions. For example, a campaign report can show whether an initial social visit, a lead form and a later sales interaction all contributed. The approach makes milestone definitions central to the result.
Choose the model against the buying journey, not its name. A short purchase path may need a simple view of the interaction closest to conversion. Longer B2B cycles can run from 3 to 18 months, so early research and later sales activity may both matter. Time-decay suits longer journeys when recent interactions deserve greater weight, though a configured half-life can preserve value for earlier touches.
Buying committees add another layer: several stakeholders may interact with marketing across different channels before one account converts. Standard attribution modelling, particularly in Google Analytics 4, does not account for account-based marketing journeys involving multiple stakeholders. Account-based programmes therefore need a view that can connect relevant people, channels and offline activity, such as sales calls, seminars, webinars or conferences.
Set the goal before selecting a rule. For B2B lead generation, linear or position-based attribution can show how early discovery and later conversion activity share credit. For account-based marketing, custom or time-decay approaches can reflect a longer, multi-person journey. For high-ticket B2B purchases, consider custom multi-touch or Markov attribution. Compare the resulting channel picture with the actions your team wants to understand, rather than treating one model as universally best.
Custom attribution models
A custom model sets credit rules around a business’s goals and customer journey. Its usefulness depends on reliable data and clear definitions of important touchpoints.
Custom Position Weights
Custom-position attribution assigns chosen credit amounts to specific points in the journey. It matters when standard weights don’t reflect how a business earns awareness, develops interest and creates opportunities. In one example, the first touchpoint receives 15% of conversion credit, while the middle touchpoint receives 35%. Teams can use custom weights to emphasise interactions that fit their goals.
Consider a SaaS journey that includes a blog post, a case study and a webinar. One example assigns 20% credit to the blog, 25% to the case study and 20% to the webinar. These allocations show how analytics can redistribute credit beyond the final interaction. Other touchpoints in the journey can receive credit under the model’s remaining rules.
Touchpoints and Journey Complexity
Customer journeys vary in the channels and interactions people use before converting. A prospect might discover a brand through organic search, read a blog, attend a webinar and later respond to an email. A custom model can assign credit to these touchpoints according to their roles, rather than treating every interaction as identical.
That flexibility requires discipline. Define what counts as an interaction, which outcome earns attribution, and how each touchpoint should contribute. A lead-generation team, for example, may value awareness-building content, while a sales team may focus on interactions linked to opportunity creation. Without agreed definitions, the same journey can produce conflicting reports.
Custom models rely on a substantial base of reliable data. If records omit campaign details or fail to connect key interactions, the model has less information for assigning credit. This matters when a journey spans channels: the model can compare only touchpoints that analytics can identify and link to an outcome.
Review custom weights against the decisions they are meant to support. If a model gives early content more credit, consider whether that helps explain how customers discover the business. If it prioritises a later demonstration, ask whether the goal is to understand opportunity progression. Compare the custom result with a simpler model to see how the rules change channel interpretation.
A custom model is not automatically more accurate because it has more rules. Its weights should reflect the business objective, and the underlying journey data should support those choices. Clear assumptions help teams understand why credit shifts between channels and use the resulting view to make more informed marketing decisions.
Single-touch attribution models
Single-touch attribution assigns all conversion credit to one interaction in the customer journey. It gives teams a straightforward reporting rule, but leaves other clicks and marketing activities out of the credit for that conversion. First-touch and last-touch are the two common approaches. Each highlights a different point in the funnel, so the right choice depends on the decisions the report needs to support.
First-touch attribution assigns 100% of a conversion’s credit to the customer’s initial touchpoint. If someone first discovers a business through a display ad, then later searches for its name and buys, the display ad receives all the credit. This view can help measure brand awareness and lead discovery. It doesn’t show which later interactions helped turn awareness into action.
Last-touch attribution assigns 100% of the credit to the final touchpoint before purchase. If a customer reads a blog, clicks a paid search ad and then buys, the paid search ad receives all the credit. This makes the final interaction easy to identify, but can hide earlier contributions. It can be useful when the buying cycle is short and the last interaction is a relevant measure.
Click attribution narrows the rule further by giving all conversion credit to the last click before purchase. This matters when a journey includes non-click interactions, such as an impression or an offline conversation. First-click attribution instead credits the initial interaction. Both produce a simple report, but each describes only one selected moment in the journey.
Single-touch models can suit short buying cycles, where the initial or final interaction offers a practical signal. First-click is useful when a business wants to assess awareness, while last-click can help examine actions close to conversion. One recommendation suggests first-click for businesses with an average time from first touch to purchase under two weeks. The choice should still reflect what the team wants to learn.
Multi-touch attribution takes a different approach by sharing credit across interactions. It can show how awareness-building activity and later conversion actions work together, but teams need to interpret multiple contributions. A first-touch report, for example, may favour a discovery campaign, while a last-touch report favours the closing channel. Comparing both with a multi-touch view reveals how the attribution rule shapes marketing insights.
Use single-touch reporting when one point in the funnel answers a specific question, such as which interaction introduced new customers. Use multi-touch when decisions depend on understanding a sequence of actions. Neither approach proves that a channel caused the purchase. Treat attribution as a way to organise observed interactions, then compare model outputs with sales outcomes before changing campaign priorities.
Reviewing and comparing attribution models
Algorithmic attribution uses data to distribute credit, while first-click credits the initial interaction, last-click the final one, and linear attribution shares credit equally. Compare their outputs with campaign goals and sales outcomes before using them to guide decisions.
Comparing Attribution Approaches
Each model presents a different view of the same conversion journey. First-click can highlight awareness, last-click focuses on the final recorded action, and linear attribution treats every touchpoint equally. Algorithmic attribution estimates contribution from patterns across recorded journeys instead of applying one fixed rule. Comparing these outputs matters because campaign priorities can shift with the attribution method.
A customer might first see a social advert, later read a search result, then convert after an email. First-click favours social, last-click favours email, and linear attribution divides credit across recorded interactions. A data-driven model estimates how those interactions relate to conversions based on available data. These comparisons explain why channel credit changes between models.
Measuring Model Accuracy
Assess a model’s usefulness by comparing its output with other evidence, not by treating its credit totals as proof of cause. Review conversions under more than one model, then check whether channel patterns align with sales insights. If the model credits an initial campaign but sales conversations point to later activity, investigate the gap before changing budgets.
Check tracking consistency across campaigns and conversion events. Cookie-based tracking for a 90-day B2B journey can become unreliable beyond 7-14 days without persistent cookies. Missing interactions can make the apparent path incomplete, so compare reported journeys with available sales records and known channel activity.
Benefits and Limitations
Algorithmic attribution can use machine learning to identify patterns across touchpoints and distribute credit beyond a single click. This offers a broader view than first-click, last-click or linear rules. The choice between Markov and Shapley value models depends on the available data and analysis needs.
However, results depend on tracking quality and coverage. Missing cross-device activity or offline interactions can distort the journeys analysed. Shapley value calculations can also be computationally demanding: calculating them for 15 channels requires 32,768 coalitions. Keep algorithmic attribution modeling explained in practical terms by comparing its outputs with other evidence, not treating its allocation as proof that a campaign caused a conversion.
Tie reviews to a clear decision rhythm. Refresh attribution dashboards monthly and make budget decisions quarterly. Reassess the model at least quarterly, or when strategy, campaigns or the customer journey changes. This helps teams spot when a previously useful way to distribute credit no longer fits current marketing activity.
Explore multi-touch attribution features
Nodal AI: Nodal Platform
Nodal AI’s Nodal Platform turns fragmented data into actionable intelligence for marketing decisions. When attribution reports leave your team manually piecing together channel performance, Performance Marketing Analytics helps bring performance insights into view, while Growth Recommendations support decisions about what to examine next. Automated Reporting makes recurring performance information easier to review. These tools are relevant when your team needs a clearer picture of how marketing activity connects with customer journeys and conversions. Use the insights to compare attribution outputs and inform further analysis, rather than treating a model’s credit allocation as proof of cause. Contact Nodal AI to discuss how the platform can support your performance marketing analysis.
Turn attribution insight into better questions
Understanding algorithmic attribution in relation to your business priorities can turn model outputs into a useful decision framework. Before acting, decide what evidence would change your next move and which assumptions deserve closer examination.
If you need algorithmic attribution explained in relation to a specific planning decision, start by defining the question your analysis should answer. This gives your team a practical way to connect attribution insights with future campaign choices and learn from the results.
Ask focused questions, and let each decision sharpen the next.
Frequently Asked Questions
How does data-driven attribution work?
Data-driven attribution analyses recorded journeys to estimate how different interactions relate to conversions. It can compare patterns in journeys that convert with those that do not, then adjust the credit assigned to channels. For example, if a campaign commonly appears in converting journeys but rarely in others, the model may associate it with a stronger contribution. That association can guide analysis, but it does not establish that the campaign caused each conversion.
What is algorithmic attribution modeling in marketing?
Algorithmic attribution modeling uses data and computational methods to estimate how marketing interactions contribute to conversions. Instead of relying only on a fixed allocation rule, it can account for patterns across recorded customer journeys. A marketing team might use it to examine whether search, social and email activity appear together in converting journeys, then use those insights to inform campaign planning and performance analysis.
How does algorithmic attribution modeling work?
The process starts with recorded interaction and conversion data, then applies a method to estimate each channel’s contribution. The model analyses patterns across journeys and produces a credit allocation marketers can compare with other evidence. In practice, teams define the conversion being analysed, review the available data, interpret the output, and assess whether the findings fit sales activity. The method and data coverage shape the result.
How does algorithmic attribution modeling assign credit across touchpoints?
The model estimates how interactions relate to conversions, then distributes credit according to its calculations. The allocation can change when it detects that particular channels or sequences appear more often in converting journeys. For instance, if paid search often follows earlier content interactions, the model can account for both instead of treating the final click as the whole story. The result is an estimate based on observed data.
What are common algorithmic attribution models and methods?
Markov models and Shapley value models are two widely used algorithmic methods. A Markov approach examines channel sequences and estimates how removing a channel affects the path to conversion. Shapley value analysis considers channel contributions across possible combinations. Markov methods can work with less data and require less computation than Shapley analysis, so the choice depends partly on available journey data and analytical requirements.
What privacy, consent, and data-quality risks affect algorithmic attribution?
Consent choices can reduce the interactions available for analysis, while inconsistent tracking can leave journeys incomplete. Cookie consent rejection reaches 40-60% in some European markets, which can limit observed behaviour. Cross-device activity may also appear as separate journeys if records cannot connect it. Inconsistent campaign names, duplicate events or missing conversion records can distort channel comparisons, so teams should interpret model outputs alongside the data’s coverage and limitations.


