

Customer journey analytics software connects scattered customer interactions into a clearer view of the journey. It brings together behaviour across channels, maps key touchpoints and uses attribution to show how those interactions relate to conversions. This helps teams see where customers engage, stall or leave.
Choosing a tool is only part of the challenge. You also need to know which data it can bring together and how its insights can guide decisions across teams. Without that connection, dashboards may show activity without revealing what to improve.
This guide explains how journey analytics works, how mapping and attribution reveal customer behaviour, and which measures can highlight friction and conversion opportunities. It also shows how to turn those insights into practical improvements, making customer journeys easier to understand and act on.
Key Takeaways
- Start with a clear business goal, then choose data sources and reporting views that help answer it.
- Combine journey maps with behavioural data to test assumptions and spot friction between touchpoints.
- Use multi-touch attribution, path analysis and cohort analysis to understand how interactions relate to conversions.
- Pair funnel and retention measures with customer feedback to identify where experience improvements may have the greatest impact.
- Turn insights into focused changes, then keep measuring how customer needs and journey patterns evolve.
Looking for the best customer journey analytics tools?
The best customer journey analytics software connects customer data, maps interactions across channels and turns reporting into decisions. Compare how each platform links records, handles consent and answers a specific business question.
Customer Data Connections and Unified Profiles
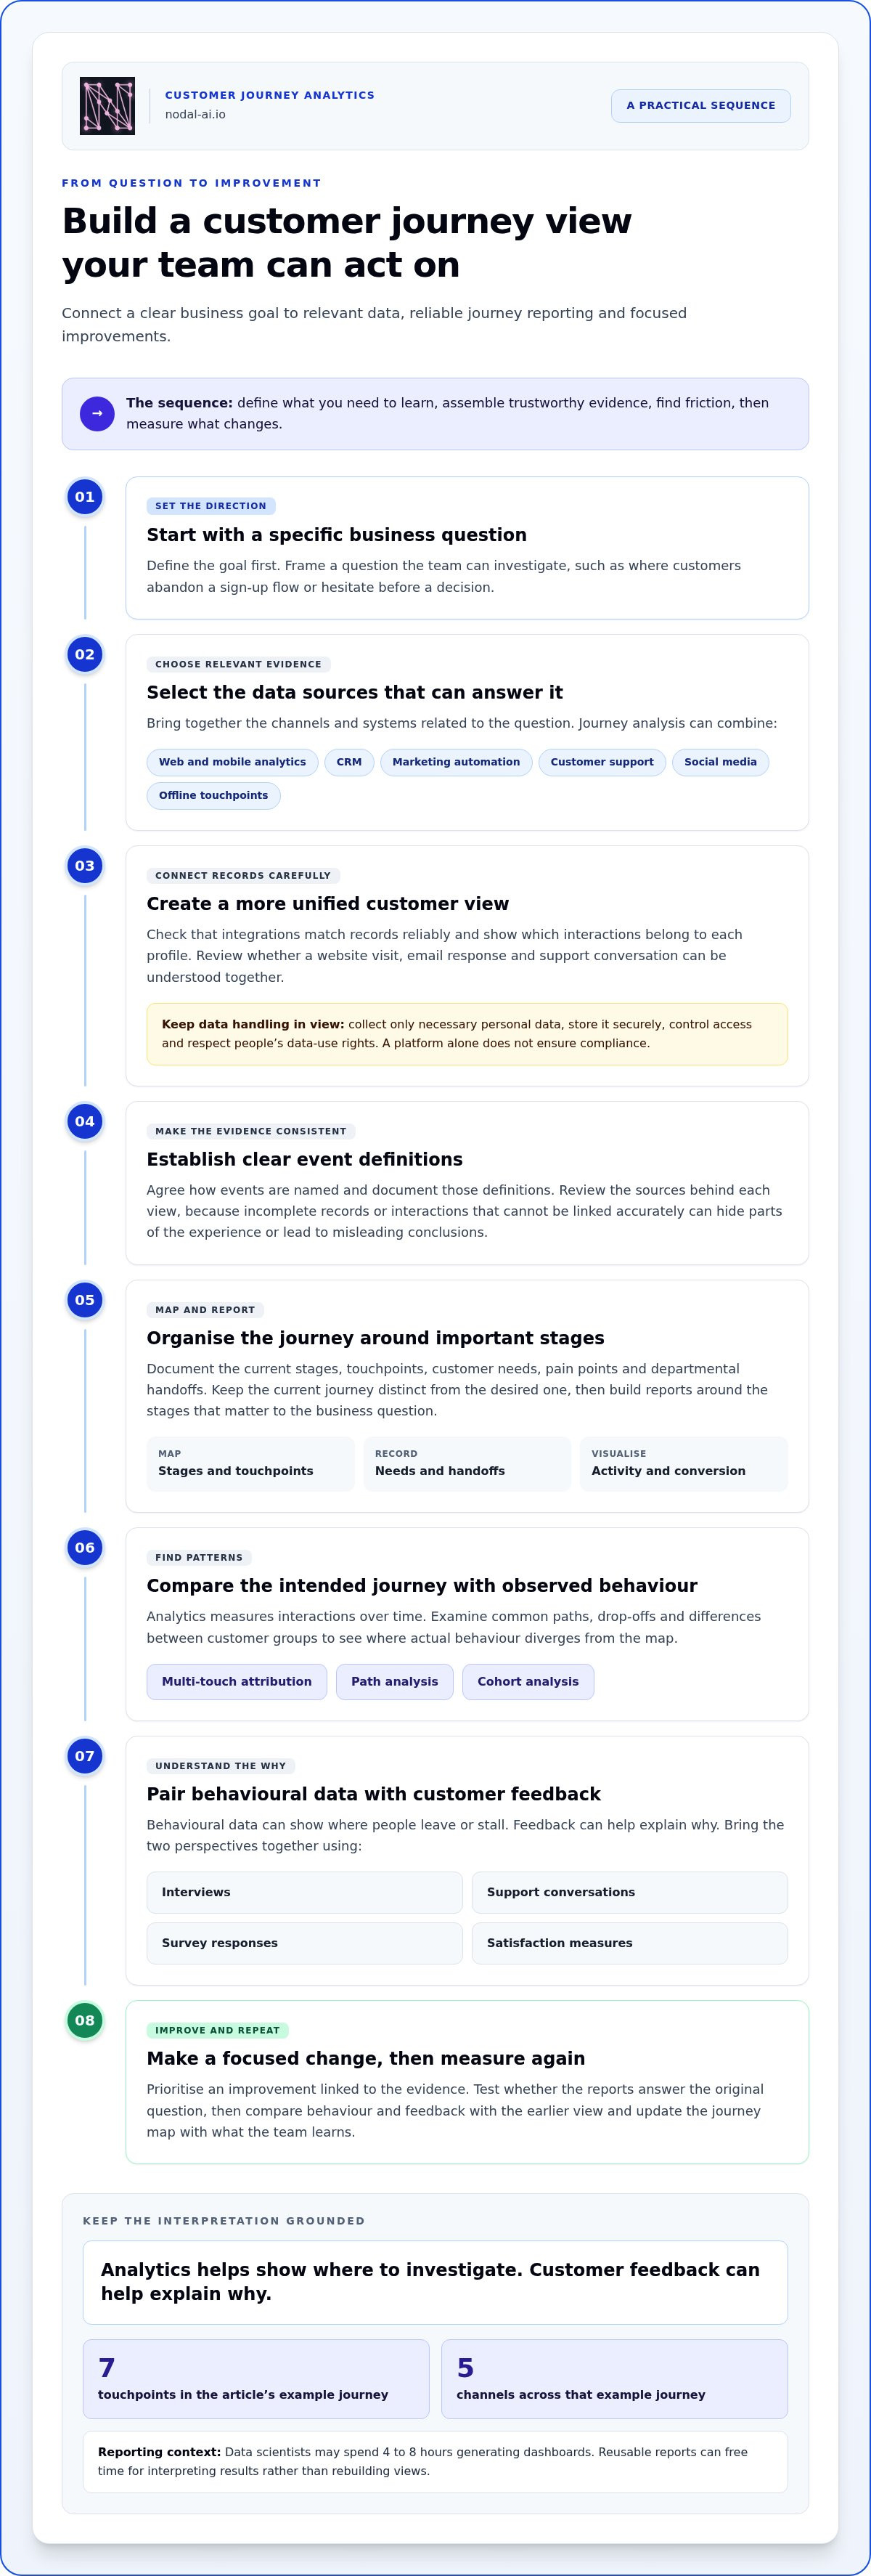
A customer data platform brings interactions from different systems into unified customer profiles, often updating them in real time. This gives teams a shared view instead of separate records for a website visit, email response and support conversation. Check whether integrations match records reliably and show which interactions belong to each profile.
For privacy, configure the platform to collect only necessary personal data, store it securely, control access and respect people’s data-use rights. Consent signals and data-handling workflows can support CCPA compliance, but the platform alone doesn’t ensure compliance.
Interaction Data Sources and Consolidation
Journey analysis can combine web and mobile analytics, CRM, marketing automation, customer support, social media and offline touchpoints. For example, a customer may browse a product page, contact support and later make a purchase in a shop. Consolidating these events into a sequence helps teams see how behaviour changes across channels.
Risks include incomplete records, inconsistent event definitions and misleading conclusions when interactions can’t be linked accurately. Review the sources feeding each view and document how events are named. Strong integration improves the evidence behind customer journey mapping, but gaps in the data can still hide parts of the experience.
Visualisation and On-Demand Reporting
Visual dashboards present journey stages, channel activity and conversion patterns in a format teams can explore. On-demand reporting lets analysts adjust a view around a question, such as where customers abandon a sign-up flow. Data scientists may spend 4-8 hours generating dashboards, so reusable reports can free time for interpreting results rather than rebuilding views.
There’s no single standard US price for this software. Pricing depends on the case and is provided after a quote request; relevant factors include data volume, integrations, users and reporting capabilities.
Platform Features and Implementation
Key features include data integration, unified profiles, journey visualisation, behavioural analysis, attribution and flexible reporting. To implement a platform, first define a business goal, then select and connect relevant data sources, establish consistent event definitions and build reports around important journey stages. Test whether the resulting views answer the original question.
This sequence keeps setup focused. A team investigating checkout abandonment, for instance, can prioritise checkout events and conversion reporting before adding unrelated sources. Compare platforms by how clearly they connect each step, from source data to an insight your team can act on.
Customer journey mapping
A journey map shows how people engage with a business, from their first interaction through conversion and retention. Analytics adds observed behaviour, allowing teams to compare the intended journey with the actions customers actually take.
Mapping and analytics answer related but different questions. A map describes stages, touchpoints, customer needs and departmental handoffs. Analytics measures interactions over time, revealing common paths, drop-offs and differences between customer groups. Together, they help teams test assumptions rather than treat an internal process diagram as proof of the customer experience.
Consider an example journey with seven touchpoints across five channels. A person might see a campaign, visit a website, read an email, speak with sales and make a purchase, with other interactions along the way. The map organises these encounters by stage and records the customer’s goal, questions and potential friction at each point. Analytics then shows which routes customers take and where behaviour differs from the expected journey.
This comparison can reveal problems hidden between departments. For example, a map may show customers moving from a product page to a sales conversation, while behavioural data shows many leave before booking. Teams can examine the relevant actions and handoffs, then investigate whether unclear information, a slow response or a confusing next step contributes to the gap. Data identifies where to look; customer feedback can help explain why.
Use qualitative and quantitative evidence together. Interviews, support conversations and survey responses describe what customers say or feel, while behavioural data shows what they do across the journey. If a campaign generates visits but few customers progress, the map can connect that result to the page, message and transition they experience. Satisfaction measures add another perspective, showing whether a completed action also felt straightforward.
Keep the map useful by distinguishing the current journey from the desired one. First document existing stages, touchpoints, pain points and handoffs. Then use analytics to measure each stage, identify patterns and prioritise opportunities. After a change, compare behaviour and feedback with the earlier view. Each updated version then records what the team has learned, not just a redesigned diagram.
Journey mapping works best when it leads to a specific improvement question, such as where customers hesitate before a decision. Analytics can then test that question against observed paths and stage performance. Explore analytics-led journey mapping to connect mapped experiences with measurable behaviour.
Organizations often start by mapping customer engagements, then measure and optimize each stage. Combining qualitative mapping with quantitative behavioral data helps validate assumptions.
Attribution and behavioural analytics tools
These tools connect interactions with outcomes and show how patterns vary across customers. Their value lies in investigating what contributed to a result, not just identifying the last event.
Attribution and Journey Tracking
Multi-touch attribution considers the entire customer journey when assigning credit to conversion touchpoints. This matters when customers interact with several channels before deciding, because the final interaction alone can obscure earlier contributions. Journey tracking records those interactions over time, giving teams a sequence to analyse rather than an isolated conversion event.
Path analysis adds detail by mapping routes through touchpoints. It can reveal common journeys and unexpected actions, such as visitors returning to product information after starting an enquiry. Compare routes with conversion outcomes to see which paths are associated with progress and where customers tend to exit. This helps teams identify a specific stage to investigate.
Time-to-conversion metrics offer another perspective. Teams can compare how long conversion takes by acquisition source or customer characteristics, then consider whether different journeys need different follow-up. Churn analysis by journey stage can also show where customers are most likely to disengage. These measures help identify when focused attention may be useful.
Behavioural Analytics and Segmentation
Behavioural analytics examines actions across events, while segmentation groups customers by shared characteristics or timeframes. Combining them lets teams compare journey patterns across meaningful groups. For instance, a business could compare customers who joined during different acquisition periods and examine which actions precede repeat engagement.
Cohort analysis helps reveal whether journey patterns change over time and which behaviours predict success. A cohort can be defined by a shared starting period or another relevant characteristic. Compare its event sequences and outcomes with another cohort, then investigate meaningful differences. This can expose shifts that an overall average would conceal.
Choose metrics that fit the question. To understand disengagement, examine churn by journey stage and compare the actions that preceded it. For conversion, assess routes and time to conversion by source. Keep segment definitions consistent, so changes in results reflect customer behaviour rather than a different grouping method.
Finally, use journey signals to guide relevant outreach when customers show signs of disengagement. Analytics can help teams identify the pattern and timing, while the response should fit the customer’s context. This makes behavioural insight useful beyond reporting: it can guide a considered action and help teams learn from what happens next.
Benefits for customer experience and conversions
Journey analytics connects customer feedback with behaviour, helping teams see where experience and business outcomes meet. Its value comes from finding friction, choosing a focused improvement and measuring what changes afterwards. A shared view also helps teams distinguish a local issue, such as a confusing form, from a wider problem across the customer journey.
Improving Customer Experience
A connected view helps teams understand how customers experience interactions across channels, rather than reviewing each touchpoint in isolation. Journey analytics can give cross-functional teams a 360-degree view of the customer, making patterns easier to discuss across marketing, sales and service. That shared context matters when a customer’s experience spans several departments.
Combine behaviour with feedback to investigate abandonment. If customers leave after contacting support, journey data can show their preceding interactions while survey comments may explain the frustration. A dashboard can bring together customer satisfaction, NPS, CES, churn and retention measures, giving teams more context than a single score.
Customer Effort Score measures how easy or difficult people find it to do business with a company, using survey ratings. For example, repeated complaints about account setup alongside a drop-off at that stage point to an experience worth reviewing. Tracking effort alongside satisfaction helps teams assess whether changes make the journey simpler, rather than merely shifting activity elsewhere.
Supporting Conversions
Journey analytics supports conversion work by showing where customers progress or stall between stages. Funnel analysis compares conversion rates across stages, helping teams locate bottlenecks. If visitors view a product but rarely begin checkout, teams can examine the transition and test changes against the same stage-level measure.
Behavioural evidence can show which experiences occur alongside stronger conversion. For example, customers who read a blog, watch a product demonstration and speak with sales convert at three times the rate of customers who skip the demonstration. This pattern can prompt teams to investigate the demo’s role, without assuming that one touchpoint alone caused the difference.
Use a clear measurement sequence: define the journey stage, track its conversion rate, review related feedback, then assess results after a change. Pair conversion measures with churn and retention to understand whether an improvement supports the wider relationship, not just an immediate purchase. Comparing customer paths over time can reveal where experience changes deserve further attention.
When marketing, sales and service teams use the same journey signals, they can identify handoffs that need attention. A customer who receives conflicting information during a transition, for instance, may need a more consistent experience. Shared measures help teams align their actions around that need and assess whether the handoff improves.
Using analytics insights to improve customer journeys
Analytics creates value when an insight leads to a focused change and teams measure its effect. Prioritise decision and retention phases, where journey improvements can have a strong impact. For example, investigate whether unclear product comparisons stall decisions or whether a difficult renewal process weakens retention.
Start with a specific friction point, not a broad goal such as “improve the experience”. A useful question might be: do customers who reach the pricing page continue towards a decision? Connect the relevant journey stage to an outcome, such as completed purchases or repeat engagement. This ties analysis to a business need and clarifies the next action.
Next, compare journey paths and customer lifetime value. If customers arriving through one path show higher value over their relationship with the business, examine what distinguishes their experience. They may engage with different information, receive support at a key moment or follow a smoother decision process. Treat the pattern as a clue to investigate, not proof that one touchpoint caused the outcome.
Turn the insight into a testable change. If customers leave after viewing product details, for instance, teams could clarify comparison information or improve the next step. Define the target stage and outcome before implementation. Then compare relevant behaviour and conversion measures with the earlier pattern. Include retention measures when the change affects existing customers.
Keep the cycle active as customer needs, products and industry conditions change. A campaign that once attracted relevant visitors may later reach a different audience. Regular analysis can reveal when journey paths shift, while customer feedback can help explain why. Use these signals to revise priorities rather than assume an old journey map still reflects current behaviour.
Make insights usable across teams by assigning each finding an owner and a next action. For example, a repeated handoff problem may require marketing, sales and service teams to align their messages. Record the issue, the change made and the measure that will show progress. This creates a practical learning loop that links evidence to responsibility and follow-up.
Optimise one meaningful journey issue at a time. If decision-stage friction is the priority, focus analysis and resources there before expanding to unrelated changes. Once you measure the effect, retain what works, refine what doesn’t and use the next insight to guide improvement.
When you are ready to discuss your journey analytics goals with the Nodal AI team, we can help you turn complex data into actionable strategies.
Use findings to guide the next cycle, keeping the selected change connected to the journey path and outcome it was intended to affect. Comparing customer lifetime value across journey paths can help identify valuable acquisition and engagement strategies. Use that comparison to choose which experience merits closer examination, treating observed value as a clue for further investigation.
Businesses should continuously collect and analyze customer journey data, adjusting strategy as industry, product and customer needs change. Revisit whether the original journey issue remains the priority and whether the same measure still reflects the intended outcome. Initially, focus journey optimization on decision and retention phases for their high impact potential, then use the evidence to guide subsequent choices.
Nodal AI: Nodal Platform
Nodal AI’s Nodal Platform helps growth teams turn performance marketing data into useful insights. If you’re connecting journey patterns with decisions, Performance Marketing Analytics focuses on campaign performance, while Growth Recommendations help surface possible next steps.
Automated Reporting supports teams that need clearer, repeatable views of results. Together, these offerings help organise analysis around business questions, such as which customer paths deserve closer attention or where a journey may need improvement. They’re a natural next step when your team wants to move from identifying patterns to making informed decisions.
To explore how Nodal AI can support your analytics goals, contact the team.
Make the next journey clearer
The next step is to turn a useful insight into a focused decision. Choose a customer journey analytics software approach that helps your team connect evidence to a clear business priority, then build a repeatable habit of learning from each change.
For teams ready to connect marketing performance with practical next steps, Nodal AI brings together the Nodal Platform, Performance Marketing Analytics and Growth Recommendations. Use this combination to help your team interpret customer journeys and decide what to improve next.
Start with the question that matters most to your customers and growth goals. A clear next step can turn insight into momentum.
Frequently Asked Questions
What is customer journey analytics software and how does it work?
Customer journey analytics software connects customer interactions to show how people move towards purchase and retention. It organises events from channels such as websites, mobile apps and support into customer paths, then helps teams examine behaviour and outcomes. For example, a retailer could compare journeys that include a product demonstration with those that do not, then use the difference to guide focused analysis.
What are the best platforms for analysing customer journeys in 2026?
There isn’t one best platform for every business. The right fit depends on its data environment and the decisions teams need to support. A customer data platform can unify profiles, an engagement platform can add workflow orchestration, and warehouse-native analytics can query data in a warehouse. Compare these approaches based on the questions your team needs to answer and how the insights will inform action.
How do customer journey analytics tools compare by features and use cases?
Tools differ in the work they prioritise. A customer data platform focuses on bringing interactions into unified profiles, while warehouse-native analytics works directly with warehouse data. Engagement platforms add workflows for responding to customer activity. For a team studying routes to purchase, path analysis can help; for comparing customer groups over time, cohort analysis can show how behaviours and outcomes differ.
How do you choose customer journey analytics software for a business?
Begin with a business objective, such as understanding repeat purchases or improving conversion from a campaign. List the decisions the analysis must support, then assess whether a platform connects relevant data and presents useful views. Include privacy controls, data access and reporting needs in the comparison. Evaluating one real business question can show whether the insights are understandable and useful to your team.
What data sources and integrations do customer journey analytics tools support?
Common sources include web and mobile analytics, CRM, marketing automation, customer support, social media and offline interactions. Integrations bring these records together so teams can examine a journey across channels. For a subscription business, linking campaign engagement with CRM and support events could help analyse renewal paths. Prioritise connections based on the interactions your business needs to understand, then align event definitions across connected systems.


