

What if your marketing efficiency ratio changed because one report counted gross sales while another used net revenue? The calculation looks simple, but inconsistent inputs can make a useful business measure confusing. A reliable marketing efficiency ratio calculation starts with a clear definition of revenue and exactly which marketing costs to include.
If you’ve found different formulas or struggled to reconcile fragmented data, you’re not alone. MER gives you a wider view than channel ROAS, but it doesn’t prove that marketing caused every sale or explain what changed. Use it as an overall efficiency signal, then investigate the channels and commercial factors behind it.
This guide shows you how to set a repeatable formula, choose consistent reporting inputs and interpret the result in context. You’ll also see how to use MER alongside channel-level metrics, margins and business performance. Nodal AI’s Unified Metrics brings revenue and marketing data into a single view, helping teams compare the inputs behind their calculations.
Key Takeaways
- Use a clear marketing efficiency ratio calculation: divide total revenue by total marketing spend for the same reporting period.
- Set your revenue and spend scope before calculating, so your MER remains consistent from one report to the next.
- Use MER for an aggregate view and ROAS to assess attributed returns from specific ads or channels.
- Compare like-for-like periods, note changes to your measurement setup and investigate shifts before acting on them.
- Bring revenue and marketing metrics together in one view to make MER easier to interpret and use in decisions.
What marketing efficiency ratio measures, and what it cannot tell you
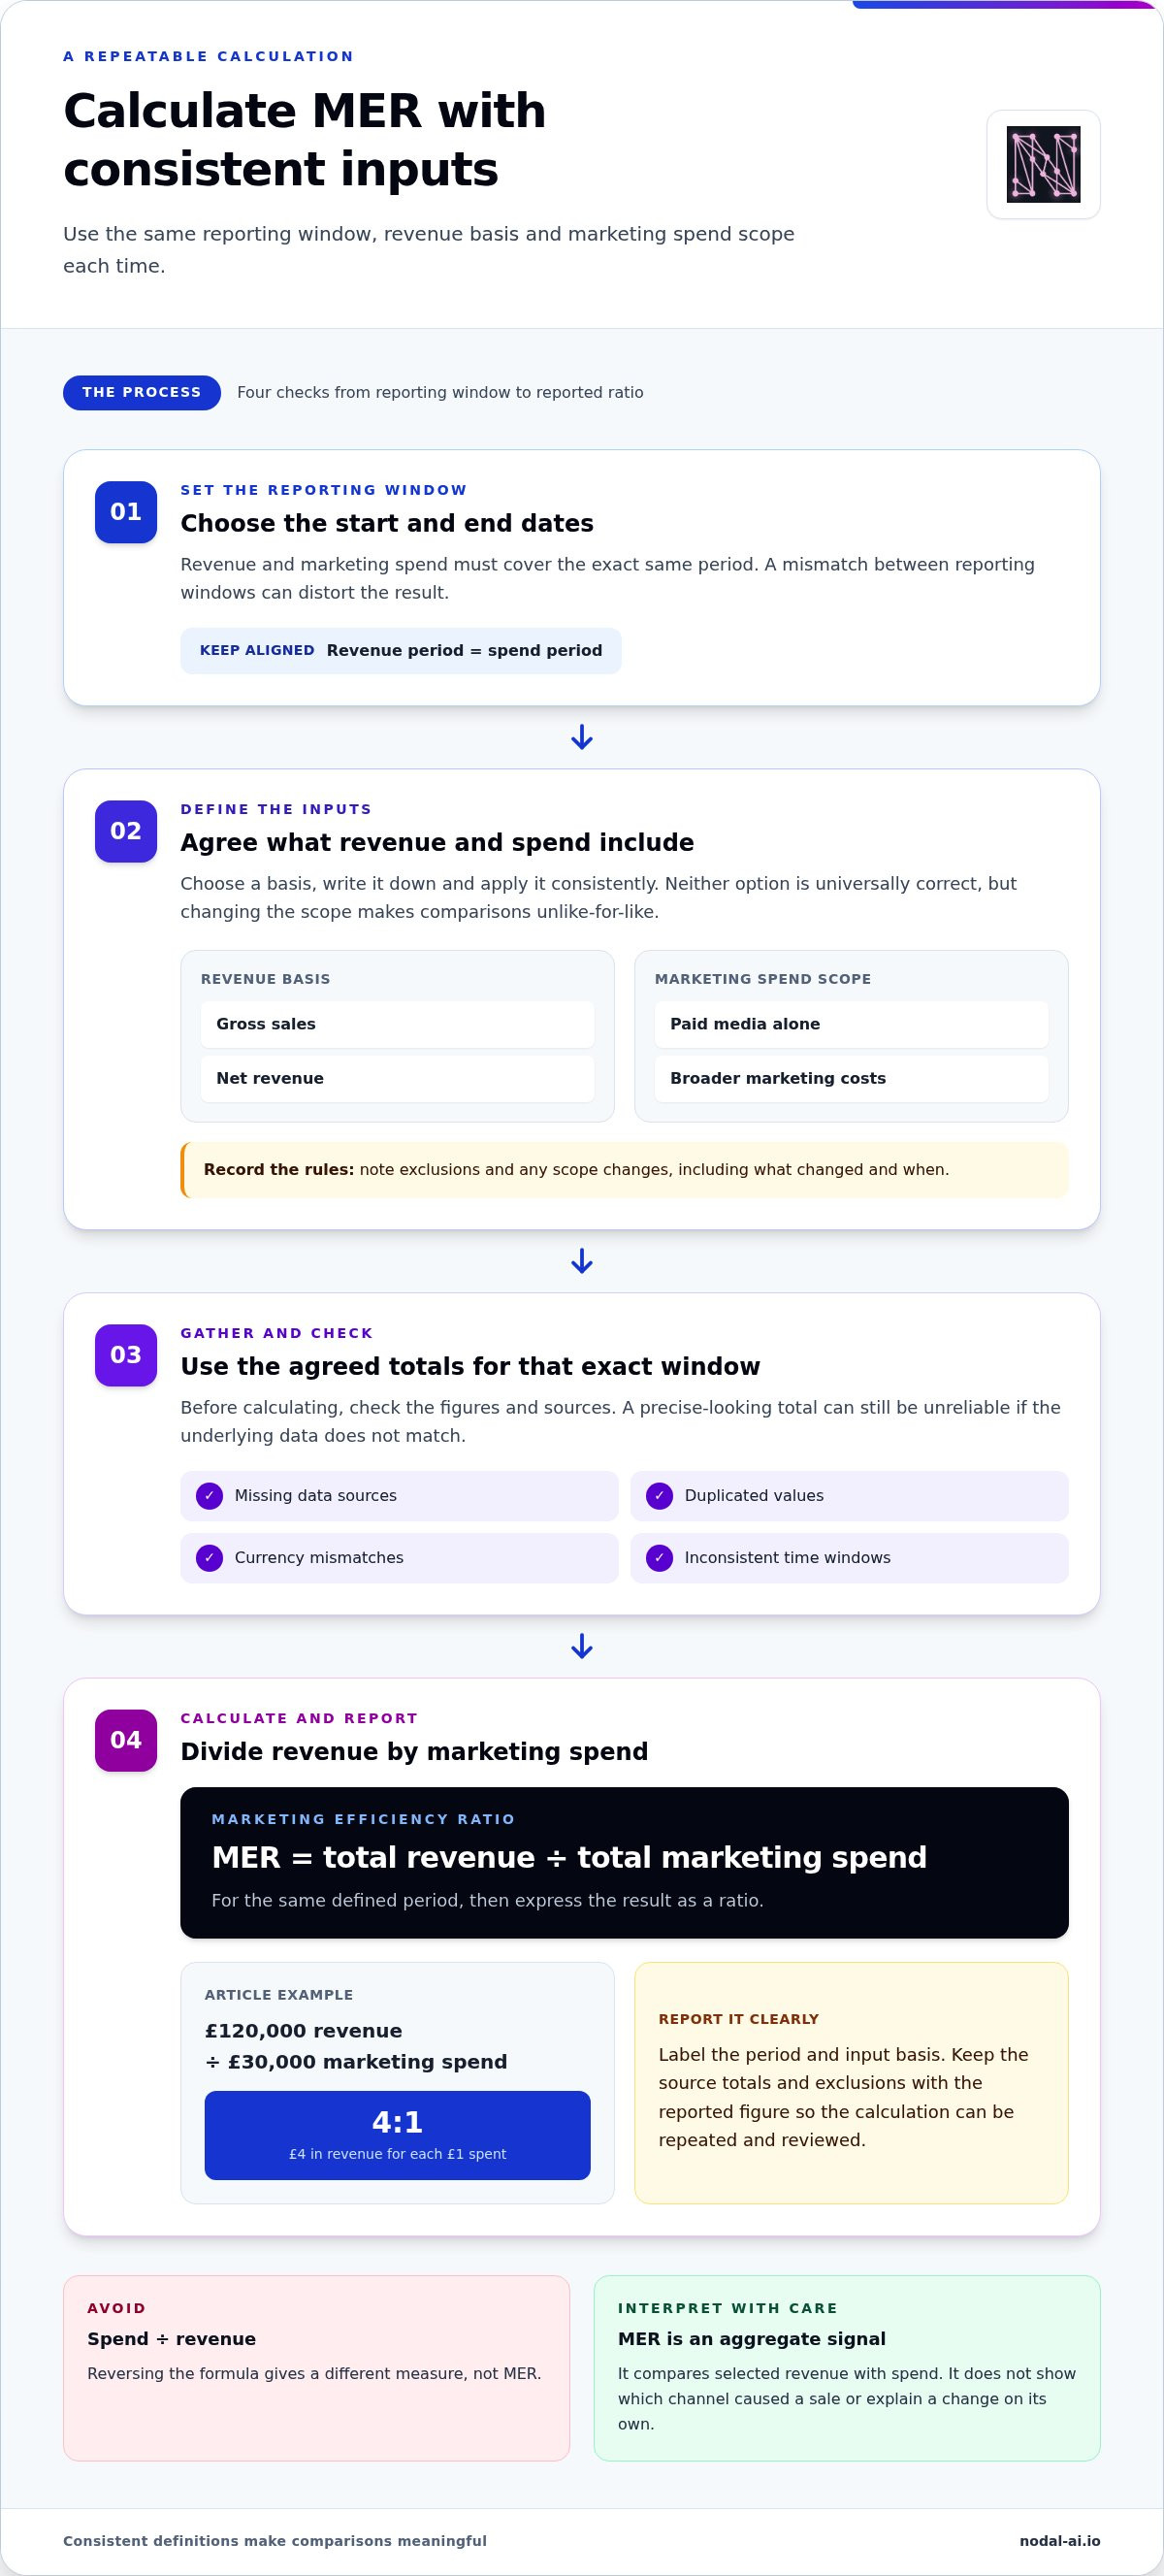
Marketing efficiency ratio (MER) compares a defined revenue total with a defined marketing spend total. In this guide, the marketing efficiency ratio calculation is revenue divided by marketing spend, expressed as a ratio. For example, if a business records £120,000 in revenue and £30,000 in marketing spend during the same period, its MER is 4:1. That means £4 in revenue for each £1 spent, based on the inputs selected.
The word “defined” matters. Revenue might mean gross sales or net revenue, while marketing spend might include paid media alone or a broader set of marketing costs. Neither choice makes the ratio universally correct. Choose a basis, record it clearly and apply it consistently.
Keep the reporting period aligned, too. Comparing one month’s revenue with another month’s spend can distort the result, as can switching from monthly to quarterly totals without considering timing. A change in the revenue basis or spend scope can make two MER figures look comparable when they measure different things. Treat such a change as a break in the reporting series, not straightforward evidence that performance improved or declined.
What does marketing efficiency ratio show?
MER is an aggregate indicator of revenue relative to marketing investment. It can help you monitor how that relationship changes over time, provided the underlying definitions and reporting periods stay the same. A rising ratio may signal improved overall efficiency; a falling ratio can flag a change worth investigating.
But a signal is not an explanation. MER doesn’t establish that marketing created the revenue in the numerator or that a specific campaign caused a change in the ratio. Sales can be influenced by factors beyond marketing, and MER combines outcomes rather than separating their causes. Broader Marketing Effectiveness considers how marketing contributes to outcomes, while MER focuses on efficiency relative to spend.
Why MER is not the same as marketing attribution
Attribution methods assign conversion credit across marketing touchpoints according to a chosen model. MER does not. It combines selected revenue and spend totals into one business-level view, so it can’t show which channel, campaign or interaction contributed to an individual sale.
That makes MER useful for monitoring the overall picture, but insufficient for diagnosing channel-level contribution. To understand how credit is distributed, use additional measurement such as multi-touch attribution, and interpret its results in light of the model and data available. A marketing attribution guide can help explain methods for analysing customer touchpoints. Keep the roles distinct: MER flags a change in aggregate efficiency; attribution methods help investigate how marketing interactions may relate to conversions. Neither a ratio nor attribution alone proves causation.
How to calculate marketing efficiency ratio with a consistent formula
Start by setting the reporting period, then collect the revenue and marketing spend that belong to that same window. The formula is straightforward. The discipline lies in applying the same definitions each time, so the result can be compared without changing what it measures.
MER = total revenue for a defined period ÷ total marketing spend for that same period. Matching periods are essential for a meaningful marketing efficiency ratio calculation.
For a symbolic example, let R represent the selected revenue total and S the selected marketing spend. Calculate R ÷ S, then express the result as a ratio, such as x:1. The number describes revenue relative to each unit of spend under your chosen scope. It isn’t a profit margin or a channel-level return.
Define the revenue and spend inputs before calculating
Choose the revenue basis your organisation will use, such as gross sales or net revenue, and keep that choice consistent. Then decide whether marketing spend covers paid media alone or a broader range of marketing costs. There’s no useful comparison if one report uses a narrow spend total and the next silently includes more activities.
Write down exclusions and reporting rules alongside those definitions. This gives anyone preparing or reviewing the figures a clear reference, and makes changes visible rather than accidental. If the scope must change, record what changed and when, so later comparisons aren’t mistaken for like-for-like results.
Follow the calculation steps and check the result
Once the inputs are defined, follow the same sequence for each report. Gather the period’s revenue and marketing spend totals, confirm that they use the agreed definitions, then divide revenue by spend. Report the answer as a ratio and label the period and input basis clearly.
- Set the start and end dates for the reporting window.
- Gather the revenue and marketing spend totals for that exact window.
- Check the figures, then divide revenue by spend and record the ratio.
Before publishing, look for missing data sources, duplicated values, currency mismatches and inconsistent time windows. A total assembled from different currencies or date ranges can produce a precise-looking answer that isn’t reliable. Keep a brief calculation note with the reported figure, including the source totals and any exclusions, so the process can be repeated and reviewed.
Don’t reverse the formula by dividing spend by revenue and labelling the result MER. That calculation gives a spend-to-revenue percentage when multiplied by 100, which answers a different question. Keeping the direction explicit prevents teams from comparing unlike measures. To see how revenue and marketing metrics can be viewed together, explore unified marketing metrics.
MER vs ROAS: choose the right measure for the decision
MER and return on ad spend (ROAS) answer different questions. MER gives you an aggregate view of revenue relative to marketing investment across a defined scope. ROAS evaluates attributed revenue against ad spend for a particular channel, campaign or other advertising unit. Use them together: one gives you the wider view, while the other helps you inspect a specific part of it.
| Measure | Calculation scope | Question answered | Main limitation |
|---|---|---|---|
| MER | Defined total revenue ÷ defined total marketing spend | How does revenue compare with marketing investment overall? | Doesn’t assign revenue to channels or explain what caused a change. |
| ROAS | Revenue attributed to an ad, campaign or channel ÷ its ad spend | What return does the selected attribution framework report for this activity? | Depends on attribution choices and doesn’t show the full business picture. |
Neither metric proves incremental impact. A channel can receive attributed credit for a conversion without demonstrating that the conversion would not have happened otherwise. Likewise, a shift in MER can reflect changes beyond campaign performance, including changes in the revenue or spend included in the calculation. Treat both measures as evidence to investigate, not as standalone proof of cause and effect.
When MER is more useful than channel ROAS
Choose MER when the decision concerns overall marketing efficiency across the business scope you’ve defined, such as reviewing the broad direction of performance or considering total investment. It may reveal a business-wide trend that separate channel reports obscure. But a change in MER doesn’t identify the campaign responsible, so use it to prompt analysis rather than assign credit.
When ROAS and other measures add necessary detail
Use ROAS to assess attributed performance within a channel or campaign framework. Its reported result can vary with the attribution model, conversion window and data available, so interpret comparisons in light of the method used. For more on how different methods assign credit across touchpoints, explore the marketing attribution guide.
Then ask a separate question: what activity generated additional outcomes? Incrementality analysis investigates whether marketing produced outcomes beyond what would otherwise have occurred. MER and ROAS can help identify where to look, but neither answers that question on its own.
In practice, a marketing efficiency ratio calculation supports a strategic view, while channel ROAS can help diagnose reported performance within a specific advertising framework. If aggregate efficiency shifts, review channel results alongside the measurement rules and commercial context before changing investment. A unified view of marketing and revenue metrics can make that comparison easier to examine; see how unified marketing metrics are brought together.
How to use MER in reporting without misleading your team
A dependable MER report is more than a ratio on a dashboard. It gives your team a consistent way to spot movement, ask better questions and decide what to investigate next. Use a repeatable workflow, then place the result beside the commercial context that could help explain it.
Set a baseline and interpret movement in context
Choose a reporting cadence that fits your organisation’s decision cycle, and establish a baseline using consistent definitions. Monthly, quarterly or another regular interval can work, provided each comparison uses equivalent periods and the same revenue and spend scope. Label any change to those rules clearly instead of presenting the figures as directly comparable.
Read MER alongside relevant commercial outcomes. Seasonality, pricing changes, promotions, shifts in customer mix and external conditions can affect revenue at the same time as marketing activity. A ratio alone cannot separate those influences. This matters beyond e-commerce: the revenue basis and marketing scope should reflect the business, whether it earns through subscriptions, services, repeat purchases or another model.
A high MER is not automatically proof of profitable growth. Revenue may be rising relative to marketing spend while margins, acquisition costs outside the selected scope or other commercial factors tell a different story. There’s no universal “good” MER. Rules of thumb can offer a starting point, but a useful target depends on business economics, growth priorities and what the calculation includes. Gross margin can help establish a business-specific break-even point: break-even MER = 1 ÷ gross margin, with the margin expressed as a decimal.
Investigate changes instead of treating MER as attribution
When the ratio moves, follow the evidence rather than assigning credit immediately. Use this workflow to keep analysis disciplined and repeatable:
- Define scope: Confirm the revenue basis, spend categories and exclusions.
- Align inputs: Use the same reporting window and check that source data is complete.
- Calculate: Apply the agreed formula and record the result with its period and scope.
- Compare: Review like-for-like periods, noting seasonality and any measurement changes.
- Investigate: Review channel and campaign measures, then examine shifts in demand, customer mix, pricing or promotional activity.
- Document: Record what changed, what you checked and what remains uncertain.
If the decision requires evidence that marketing contributed additional outcomes, use incrementality or impact analysis rather than treating MER as attribution. For planning ahead, predictive modelling can add a forward-looking view to historical reporting, but forecasts should complement careful interpretation of actual results.
Consistent reporting turns MER from a headline number into a useful starting point for commercial analysis.
Explore marketing performance reporting
How unified marketing data makes MER easier to act on
A consistent formula is only useful when the revenue and marketing inputs behind it can be brought together and reviewed with confidence. Fragmented reports can make that difficult: totals may sit in separate systems, use different definitions or cover different time windows. A unified view helps teams examine agreed inputs together, then move from calculating MER to understanding what deserves attention.
Bring fragmented revenue and marketing metrics into one view
Nodal AI’s Unified Metrics brings revenue and marketing metrics into a single view. The platform integrates with Meta Ads, Google Marketing Platform and Google Analytics, helping teams bring performance information from these sources together for analysis. With the agreed reporting scope in view, teams can more easily spot missing inputs or inconsistencies before they shape a business decision.
Explore the unified analytics features to see how connected metrics can support a clearer view of performance. A shared view doesn’t replace the need to define revenue and spend consistently. It gives teams a practical foundation for reviewing those inputs and discussing results using the same information.
Move from a ratio to an informed growth decision
MER can signal a pattern, but it doesn’t identify the cause by itself. If the ratio changes, teams still need to investigate which commercial or marketing factors may be associated with the movement. Nodal AI’s Impact Analysis helps examine initiatives in relation to longer-term revenue and retention, adding a deeper layer of investigation beyond the headline ratio.
Ovolo Hotels reported a 15.3% reduction in acquisition costs and a 24.5% increase in ROAS. These are case-study outcomes, not evidence that MER caused the improvements. They illustrate the value of examining performance through relevant measures and analysis, rather than relying on one aggregate figure to explain the whole story.
Use the combined view to follow a practical sequence: bring the inputs together, identify a change worth investigating, and assess relevant initiatives alongside longer-term commercial outcomes. This helps keep the calculation useful without asking it to prove more than it can. It also gives teams a clearer basis for deciding what to examine next.
Turn fragmented performance data into a more informed view of marketing and revenue.
Turn your measurement into a more confident next move
Make your next step practical: turn MER reporting into a regular decision habit. At each review, identify one question the figure raises, agree what evidence would help answer it, and assign someone to follow up. That keeps analysis connected to action instead of letting a dashboard become the endpoint.
A clear record of decisions can also sharpen future reviews. Note what the team chose to investigate, what changed afterwards and which assumptions still need testing. Over time, this creates a useful thread between measurement and planning, helping teams learn from decisions rather than treating each reporting cycle as a fresh start.
Use your marketing efficiency ratio calculation as a prompt for the next business question, not a verdict on performance. With a disciplined process and analytical tools that bring metrics together, your team can move from uncertainty towards decisions grounded in clearer evidence.
Take the next step with a clearer view of performance. Book a Nodal AI analytics platform demo.
Frequently Asked Questions
What is the formula for marketing efficiency ratio?
The marketing efficiency ratio calculation used here is revenue for a specified period divided by marketing spend for that same period, reported as a ratio. Set clear boundaries for both inputs before comparing results. Some sources use different labels or show spend divided by revenue as a percentage, which is a different measure. Check the formula and scope behind any reported figure before using it in a benchmark or presentation.
Is a higher marketing efficiency ratio always better?
No. A higher MER means more measured revenue relative to the spend included, but it doesn’t necessarily mean more profit or prove that marketing generated additional sales. Revenue could rise while product margins fall, for example, or the calculation could exclude costs relevant to the decision. Compare equivalent periods, then consider profitability, customer mix and channel-level results to understand whether the change supports the business goal.
What revenue should I include when calculating MER?
Choose the revenue measure that fits your reporting question and apply it consistently. A business might track total recognised revenue for a broad view, or use a narrower measure to examine a particular product line or customer segment. Decide how adjustments such as refunds or cancellations are treated, and record the reporting period and rules. Keep those choices stable for future comparisons, or clearly label any change in basis.
Should MER include all marketing costs or only advertising spend?
It depends on the question. Including paid-media spend can give you a view of advertising efficiency, while including a broader set of marketing costs answers a wider investment question. Define which channels and cost categories are in scope, including how shared costs are handled, and name the measure accordingly in reports. A ratio based on advertising spend alone shouldn’t be compared directly with one that includes broader marketing costs.
How often should I calculate marketing efficiency ratio?
Calculate it on a cadence that matches your planning and reporting cycle, then keep that interval consistent for comparisons. The right frequency depends on how quickly your business makes decisions and how complete its revenue data is. If source data arrives with delays, a very short reporting window may give an incomplete picture. Note data cut-off dates and scope changes, and interpret each result alongside relevant business conditions.
What is the difference between MER and ROAS?
MER gives a broad view of revenue relative to the marketing spend in scope, while ROAS reports revenue attributed to advertising within a channel or campaign framework. Separate platforms may each report credit for a conversion, depending on their attribution settings. MER can help frame an overall budget discussion; ROAS can help review reported performance in a particular framework. Use each for the decision it can support.
Can MER show whether a campaign caused additional revenue?
No. MER combines totals, so it can’t isolate a campaign’s incremental contribution or show what would have happened without that activity. To investigate additional impact, use a suitable test or analysis design, such as comparing outcomes between exposed and comparable unexposed groups where feasible. Consider other changes during the measurement period, too. Treat the ratio as a prompt for investigation, not causal evidence on its own.


