

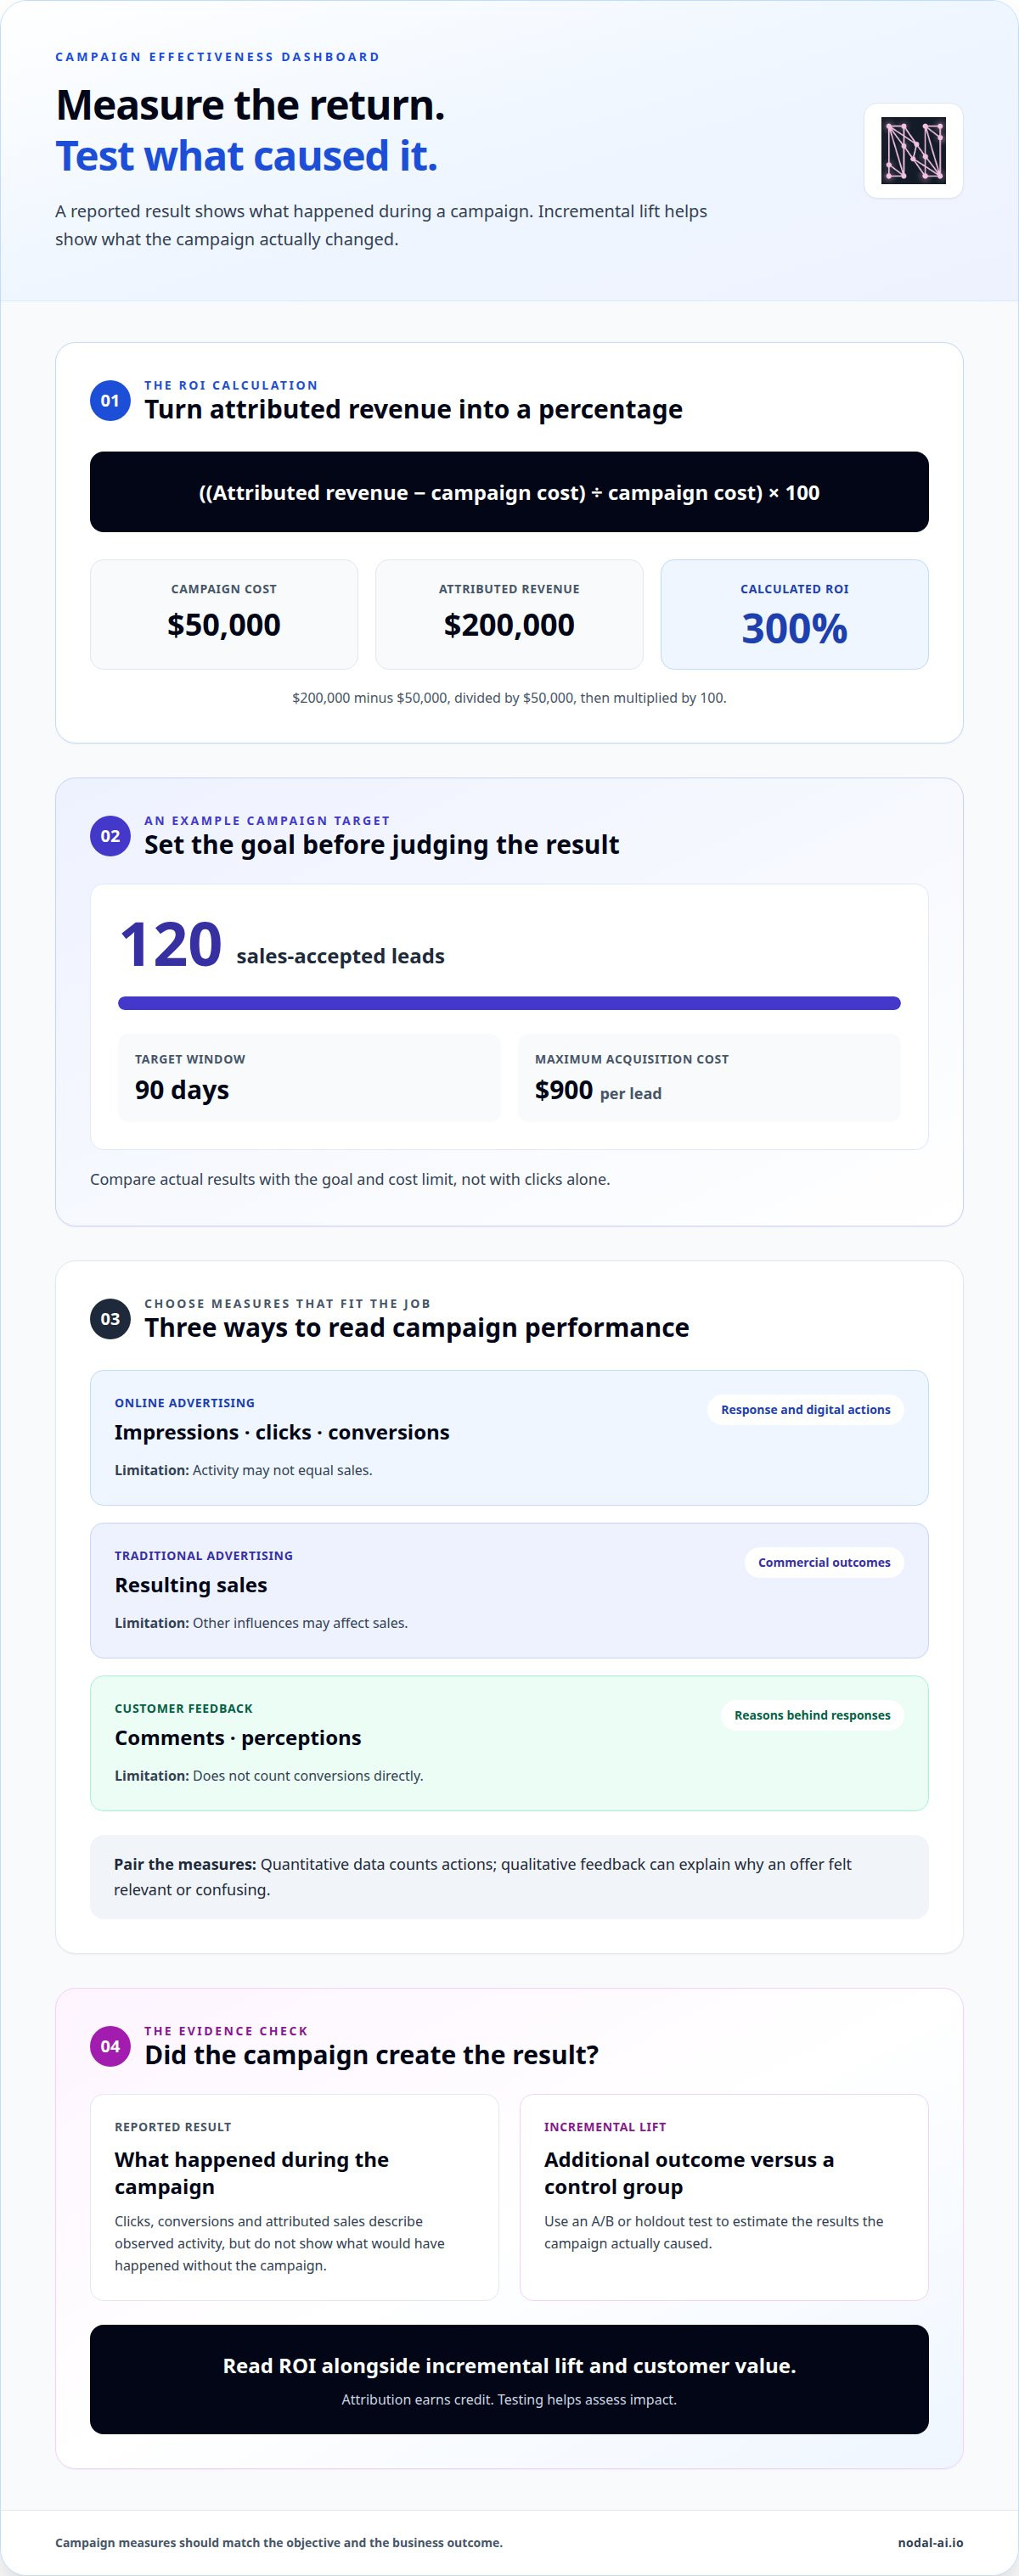
A campaign’s reported return isn’t the same as the revenue it caused. To calculate ROI, subtract campaign cost from attributed revenue, divide by campaign cost, then multiply by 100. A campaign costing $50,000 and generating $200,000 in attributed revenue has an ROI of 300%. But analyzing marketing campaign effectiveness also means asking whether the campaign created that result, rather than simply receiving credit for it.
It’s easy to focus on clicks, conversions and attributed sales. They show what happened during a campaign, but not necessarily what would have happened without it. To make a sound decision, compare observed results with incremental lift: the additional outcome measured against a control group. This guide explains how to calculate ROI, assess online metrics and use A/B or holdout tests to distinguish correlation from impact. You’ll also learn how to interpret these measures together, so your next investment decision rests on clearer evidence, not a single headline metric.
Key Takeaways
- Connect impressions, clicks and conversions to a clear business objective, so each metric has a purpose.
- Look beyond attention-grabbing numbers and assess whether activity leads to valuable customer outcomes.
- Use A/B or holdout tests to estimate the results a campaign actually caused, not just the outcomes it received credit for.
- Choose a small set of executive, operational and tactical measures to make reporting easier to act on.
- Compare ROI with incremental lift and customer value to make more informed investment decisions.
Measuring online impressions, clicks, and conversions
Measure each campaign against its objective, then connect activity to business outcomes. Online indicators show how audiences respond, while sales data and research add context that clicks alone cannot provide.
Qualitative and Quantitative Measures
Quantitative measures count actions, such as impressions, clicks, conversions and sales. Qualitative measures explain responses through customer comments, interviews or feedback about brand perception. Unlike a conversion count, a customer comment can reveal why an offer felt relevant or confusing. Combine both: use campaign analytics to spot a pattern, then examine feedback to understand it.
Enterprise Measurement Challenges
Enterprise campaigns often span channels, audiences, regions and teams, making consistent comparisons difficult. Different systems may record the same customer journey differently, while privacy practices limit how data can be connected. The European Union’s GDPR and the CCPA require businesses to handle customer data responsibly. Set shared conversion definitions, document data sources and compare like-for-like reporting periods across teams.
Channel, Audience, and Brand Measures
Compare channels using the same objective and outcome, such as qualified leads or sales, while separating audience segments. How do you compare performance across channels and audiences? Use consistent definitions, then compare conversion quality and business outcomes within each segment. How should campaign performance benchmarks vary by industry? Base them on the relevant audience, sales cycle, offer and channel mix, rather than treating one industry figure as universal.
What metrics should be used to measure marketing campaign effectiveness? Choose measures that match the goal: impressions for reach, clicks for response, conversions for action and sales for commercial impact. How do you measure brand awareness and engagement from a campaign? Track changes in brand recognition through audience feedback, and pair engagement actions with campaign reach and response data.
For online advertising, record impressions, clicks, and conversions, then connect each to the stated goal. A sample goal is 120 sales-accepted leads within 90 days, with a maximum customer acquisition cost of $900 per lead within 90 days. Compare actual results with that target, not clicks alone. A conversion rate reported as twice the industry average adds context, but still needs a clear business outcome.
Traditional campaigns often rely on resulting sales as the main measure. Compare sales during the campaign with the same offer, audience and reporting window, and record other factors that could explain a change. For any campaign format, define the audience, action and outcome before launch. This turns reporting into a test of the campaign’s purpose.
| Option | Primary measure | Best used to assess | Key limitation |
|---|---|---|---|
| Online advertising | Impressions, clicks, conversions | Response and digital actions | Activity may not equal sales |
| Traditional advertising | Resulting sales | Commercial outcomes | Other influences may affect sales |
| Customer feedback | Comments and perceptions | Reasons behind audience response | Does not count conversions directly |
Choose measures that match the campaign objective, then pair the primary metric with a complementary one.
Vanity and misleading metrics
A high number can look impressive while revealing little about business impact. A post with thousands of views, for example, may attract attention without prompting enquiries, purchases or meaningful engagement. Treat a metric as evidence of success only when it connects to a campaign objective. Otherwise, it can make weak performance appear successful and steer budget towards activity that does not advance the business.
Vanity metrics often measure exposure or interaction without showing quality, intent or commercial value. Follower totals, page views, video plays and raw click counts can provide useful context, but rarely explain what happened next. A rise in page views matters more when it leads to product consideration or a defined action. Separate the signal from the headline by asking what decision each measure can support.
Use these checks before presenting a metric as proof of success:
- Connect it to an objective: If the goal is product consideration, assess meaningful product exploration rather than total site visits.
- Check the next action: A click becomes more informative when you know whether visitors viewed relevant content or left immediately.
- Assess audience quality: Compare responses from intended customers with activity from audiences unlikely to buy.
- Look for business value: Relate campaign interactions to qualified enquiries, sales, or another outcome leadership recognises.
- Keep the denominator visible: Report a rate alongside its underlying count, so a small sample cannot look disproportionately persuasive.
Context can also overturn an apparently obvious interpretation. Philips increased product views by 16 percent by removing autoplay videos. The example shows why more exposure is not automatically better: a format that interrupts visitors may weaken useful interaction. For each campaign, compare the metric before and after a change, then examine whether the audience took more valuable actions. Do not treat a single rising number as proof that the change caused improvement.
Misleading conclusions also arise when teams compare unlike measures. An email open, a paid search click and an in-store sale represent different steps. Ranking them together without a shared objective can reward the channel that produces the easiest interaction, not the strongest outcome. Define what counts as progress for each channel, then compare their contributions to the same business goal.
Finally, distinguish correlation from contribution. A campaign and a sales increase may occur together, but timing alone cannot show that advertising caused the increase. Review seasonality, other promotions, audience changes and the customer journey before assigning credit. A practical reporting sequence is to state the objective, show the metric and its context, identify the resulting action, and explain the business implication. This makes inflated activity harder to mistake for impact.
A/B and holdout testing for incrementality
Campaign reports show recorded outcomes; experiments help estimate what a campaign caused. A/B testing compares two versions of an email, advertisement or landing page to see which drives more conversions. Holdout testing compares people exposed to a campaign with a similar group that isn’t exposed. Both methods can reveal whether a change or campaign adds results beyond the baseline.
Start by defining the outcome the test should measure. For a sales campaign, that could be purchases; for lead generation, qualified enquiries. Then assign eligible people or comparable groups to treatment and control conditions. The treatment group sees the campaign or variation, while the control group does not. Compare the same outcome across both groups over the same measurement period.
To calculate incremental lift, subtract the control group’s outcome rate from the treatment group’s rate. If the exposed audience converts more often than the unexposed audience, the difference estimates the campaign’s added effect. Use rates rather than raw totals when group sizes differ. Keep the outcome definition, attribution window and audience criteria consistent, or the comparison may reflect measurement changes rather than campaign impact.
Choose the right test
Use A/B testing to choose between two creative or page versions. Change one meaningful element, such as the headline or call to action, while keeping the audience and other conditions comparable. Use a holdout to determine whether a campaign itself creates additional outcomes. A landing-page test can identify a stronger version, while an audience holdout can assess whether sending the campaign increased purchases.
Protect the comparison from contamination. If control-group members see the campaign through another channel, the measured difference may shrink. Check audience overlap, campaign delivery and exposure records before interpreting results. For a multichannel promotion, define which channels count as campaign exposure, then apply that rule consistently to treatment and control groups.
Interpret the result in business terms. A higher conversion rate does not automatically mean the test produced a valuable outcome if conversions are poor quality or fail to progress. Review downstream actions, such as qualified leads becoming sales, alongside the primary test metric. Record the test design, audience, outcome and result so later campaigns can use the learning without confusing one experiment with another.
Incrementality testing is less useful when groups differ substantially before launch or exposure cannot be separated reliably. In those cases, improve audience matching and tracking before drawing conclusions. Keep the test question narrow: “Did this campaign create additional purchases?” is more actionable than “Did marketing work?” That clarity turns a reported result into evidence that can guide the next investment.
Campaign analytics fundamentals
Start with a compact reporting framework: the recommended starting point is 3-5 core metrics across executive, operational, and tactical layers. Each layer should answer a different decision. Executives need business impact, campaign managers need delivery and efficiency, and channel specialists need diagnostic detail. Keep the measures connected, so a change in tactical activity can be traced towards a commercial outcome.
Assign each metric to its decision-maker before building a dashboard. An executive, for example, may use revenue contribution to decide whether to continue investment. A campaign manager may track qualified lead volume to adjust audience or timing. A channel specialist may examine clicks or landing-page actions to identify where response changes. This structure prevents a dashboard from becoming a crowded list nobody can act on.
- Executive layer: connect campaign activity to outcomes such as revenue or customer acquisition.
- Operational layer: monitor delivery, lead progression, and campaign pacing.
- Tactical layer: inspect channel-level actions that explain performance changes.
Next, standardise the definitions behind each measure. If one team counts a form submission as a lead while another counts only sales-accepted leads, their reports cannot be compared directly. Record the event definition, data source, reporting period and owner beside each metric. A shared glossary also makes handovers clearer when campaigns span regional teams or business units.
Analyse individual channels, then compare their profitability to guide investment. Use a consistent method to allocate campaign costs and connect outcomes to channels. A channel with strong lead volume may contribute less profit if those leads rarely become customers. Conversely, a channel with fewer responses may be more valuable if its customers generate stronger commercial returns. Compare like-for-like objectives and audiences before reallocating budget.
Campaign analytics tools can help identify factors associated with success or failure. They can also predict effectiveness for campaigns with specified characteristics. Use these capabilities to examine patterns such as audience, message, timing or channel mix, then test whether the relationship holds in later activity. A prediction can help prioritise a decision, but does not replace checking actual campaign results against the intended outcome.
Close each reporting cycle with a decision, not just a chart. State which metric changed, what factor may explain it and what action follows. For example, if qualified leads fall while delivery remains steady, review audience fit and lead quality before increasing spend. This three-part summary turns analytics into an operating rhythm: measure, diagnose and adjust.
Campaign effectiveness formulas
Use formulas to make campaign results comparable, but match each calculation to the decision. ROI measures return relative to campaign cost; conversion rate measures how often an audience completes an action. Neither formula tells the full story on its own. Define revenue, cost and conversion terms first, then apply the same definitions across campaigns.
Campaign ROI = (attributed revenue − campaign cost) ÷ campaign cost × 100. A campaign costing $50,000 and generating $200,000 in attributed revenue has an ROI of 300%. The calculation expresses net return as a percentage of campaign cost. It depends on consistent revenue attribution and a complete cost figure, so document which expenses and sales belong in the calculation.
Don’t confuse ROI with return on ad spend, or ROAS. ROAS divides attributed revenue by advertising spend, while ROI compares return with the costs included in the campaign calculation. Because their denominators differ, the measures answer different questions. A campaign can show strong ROAS but weaker ROI once other campaign expenses are included.
Conversion rate gives another useful view: divide completed conversions by the relevant audience or visits, then multiply by 100. State the denominator clearly. A rate based on landing-page visitors cannot be compared fairly with one based on all ad impressions. Pair the rate with its underlying count and business outcome, so a percentage never stands alone.
To calculate customer acquisition cost, divide eligible campaign costs by the number of new customers acquired. Keep the cost scope and customer definition consistent when comparing channels. Then compare customer lifetime value with acquisition cost before declaring a campaign successful. Lifetime value estimates the revenue or value associated with a customer over the relationship; acquisition cost captures what it took to gain that customer. This comparison helps show whether initial conversion activity supports longer-term economics.
Incremental results require a different basis from attributed results. Attribution assigns credit across observed customer interactions; incrementality estimates outcomes caused by the campaign compared with a control. Keep these figures separate in reports. Otherwise, attributed revenue may be mistaken for revenue that would not have happened without advertising. Use test results to interpret causal impact, and attribution to understand the observed journey.
Before sharing a formula, record its numerator, denominator, timeframe and included costs. A finance team and a marketing team, for example, may calculate ROI differently if one excludes agency or production expenses. A shared calculation note prevents that discrepancy from becoming a budget argument. Revisit definitions when campaign objectives or sales processes change.
Choose ROI to assess return relative to cost, ROAS to measure revenue per advertising spend, and customer value versus acquisition cost to assess longer-term viability. Read them alongside incrementality, not as substitutes for it. Together, these measures give decision-makers a clearer view of financial efficiency and campaign contribution.
Discuss campaign measurement
Nodal AI: Nodal Platform
Nodal AI’s Nodal Platform helps organisations turn fragmented marketing data into actionable intelligence. Use it when campaign results sit across disconnected sources, making performance and customer journeys harder to understand. Performance Marketing Analytics brings campaign measures into focus, while Growth Recommendations translate insights into potential next steps. Automated Reporting gives teams a clearer view of results without repeated manual reporting.
For teams comparing attributed outcomes with test results, a connected view can make patterns easier to interpret and decisions easier to communicate. Nodal Platform is a practical next step when you need clearer visibility across marketing performance and a more coherent basis for investment decisions.
Visit nodal-ai.io to explore Nodal AI’s approach.
Make measurement part of the next decision
Turn campaign analysis into a repeatable decision process. Before each new initiative, agree who will interpret the results, which teams need to act and how learnings will shape the next plan. This moves measurement beyond retrospective reporting and gives each campaign a clear role in improving future decisions.
Record what the team learned, not just what it achieved. Capture the audience, message, channel choices and business context alongside the outcome. Over time, that shared record can help distinguish a repeatable insight from a result tied to a particular campaign. Treat analyzing marketing campaign effectiveness as an ongoing practice, and let each decision create a sharper starting point for the next.
If your team is ready for a clearer view of marketing performance, Nodal AI can help turn campaign measurement into more informed decisions.
Choose the next step with purpose, and give your team a stronger foundation for growth.
Frequently Asked Questions
How do you calculate ROI for a marketing campaign?
Calculate ROI by subtracting campaign costs from attributed revenue, dividing the result by those costs, then expressing it as a percentage. Before calculating, decide whether costs include media, production, agency support or discounts, and use the same scope consistently. A report that excludes promotional discounts may show a different return from one that includes them. State the chosen cost basis beside the result for clear interpretation.
What is campaign analytics?
Campaign analytics is the process of collecting and interpreting data to understand how marketing activity performs. It connects campaign details, such as audience and channel, with outcomes that inform business decisions. For example, a team can examine whether a particular message brings in leads that progress through its sales process. A disciplined approach to analyzing marketing campaign effectiveness turns separate reports into a useful record of what to improve.
What tools do you need to track campaign performance?
Use tools that capture activity, customer progression and business outcomes. An advertising platform can report delivery and engagement, web analytics can record site behaviour, and a customer relationship management system can show whether leads progress into opportunities or sales. Finance records help reconcile revenue and costs. Connect these sources using consistent campaign names and tracking conventions, then document which system owns each measure to avoid conflicting totals.
What’s the difference between qualitative and quantitative measures of campaign success?
Quantitative measures show amounts or rates, while qualitative measures capture explanations, opinions and experiences. A campaign may generate a measurable number of enquiries, for example, while interviews reveal that customers responded to a specific benefit in its message. Use quantitative data to establish the scale of a result and qualitative feedback to understand its context. Together, they can guide decisions about audience, messaging and follow-up.
Which attribution model should you use?
Choose the model that best reflects the customer journey and the decision your report must support. A short, direct buying process may make last-touch credit useful for operational reporting, while a longer journey may require a broader view of earlier interactions. Compare model outputs against your sales process and, where possible, test campaign impact separately. Keep the model consistent during comparisons, or apparent channel changes may simply reflect revised credit rules.
How do you calculate marketing campaign ROI and ROAS?
ROI compares the campaign’s return with the costs included in its calculation. ROAS compares attributed revenue with advertising spend alone. Use ROI to assess return against a defined cost base, and ROAS to examine revenue relative to media investment. Since the denominators differ, label each figure clearly. A report should also state which revenue is attributed to the campaign and how costs were treated.
How can marketers attribute conversions to specific campaigns and channels?
Use consistent campaign tags in links, landing pages and customer records, then connect those identifiers to conversion events. A tagged email link, for example, can help distinguish its visits from paid search traffic in analytics. Keep naming conventions stable across platforms, record meaningful offline conversions and remove duplicate records before reporting. Attribution assigns credit according to a chosen model, while experiment results can help assess whether activity caused additional outcomes.
What is the difference between marketing attribution models?
Attribution models differ in how they distribute conversion credit across customer interactions. First-touch assigns credit to the initial recorded interaction; last-touch gives it to the final one. Linear models spread credit across recorded touchpoints, while position-based approaches prioritise selected interactions. These rules can produce different channel reports from the same journey. Choose a model based on the business question, and explain it so decision-makers understand what the reported credit represents.


