

More dashboards won’t fix fragmented marketing data. A marketing data warehouse brings performance data from multiple platforms into one place for storage and analysis. To understand what a marketing data warehouse is, start with its role: it organises structured data and preserves historical information, helping teams compare performance and spot trends.
If reports disagree or channel results feel disconnected, the issue may be how data is brought together, not a lack of dashboards. This guide explains which sources a warehouse can combine, how data moves from platforms into reports, and how a warehouse differs from a database, data lake or data mart.
You’ll also learn what to consider when evaluating a marketing data warehouse, from data structure and reporting needs to how quickly information must be available. The aim is to clarify what your marketing data can tell you and help you choose a system that supports better decisions.
Key Takeaways
- See how a central store of structured marketing data can make performance easier to analyse over time.
- Map the advertising, analytics, customer, email, social and sales sources that could contribute to a joined-up view.
- Choose the right system for the job by distinguishing analytical warehouses from transactional databases, data lakes and data marts.
- Assess reporting needs, data consistency and scaling requirements before selecting a warehouse.
- Learn how Nodal AI’s analytics and reporting offerings can help turn connected marketing data into clearer decisions.
What is a data warehouse?
A marketing data warehouse brings structured performance data from different platforms into a central system for analysis. It gives teams a consistent place to examine campaign results, compare periods and retain historical records.
Think of it as a working archive, not just another dashboard. Its value depends on how well it connects sources and prepares information to answer useful questions.
Marketing Data Warehouse Definition and Purpose
A marketing data warehouse is a central store that combines structured data from marketing sources so teams can analyse performance across them. Data is organised in tables, rows and columns, then retained for queries across channels and time periods. For example, teams can compare campaign activity with sales outcomes instead of viewing each platform’s report in isolation. This shared view supports trend analysis and more consistent decisions.
Core Components and Setup
A typical warehouse setup connects data sources, a processing pipeline, storage and an analytics layer. The pipeline extracts information, transforms it into consistent formats, then loads it into the warehouse. Teams define schemas and naming conventions so fields such as campaign, date and conversion mean the same thing across platforms. In a three-tier design, an OLAP system may sit in the middle tier, accessing data and serving analytical queries.
Setup starts by choosing the business questions and sources the warehouse must support. Teams then map fields, resolve inconsistent labels and decide how often data should be refreshed. Structured tables make analysis easier, while carefully designed access controls help limit exposure of sensitive information.
How a Marketing Data Warehouse Works
How does a marketing data warehouse work? Data moves from source systems through processing and into reports. ETL means extract, transform and load: data is collected, cleaned or reshaped, then stored for analysis. SQL-based batch processing runs queries against this structured data, and the warehouse is optimised to return analytical results efficiently. Refresh schedules determine how current your reports are.
Marketing data warehouses commonly preserve historical records, allowing analysts to compare results across campaigns or time periods. Processing may happen in batches, with data extracted hourly or daily; warehouse reporting latency can range from minutes to hours. This makes a warehouse useful for performance analysis, rather than decisions that require instant updates.
What data privacy and security rules apply to marketing data warehouses in the United States? Obligations depend on the data, the people it concerns and the organisation’s activities. Privacy and security controls should address access, retention and permitted use. The warehouse should protect sensitive records and restrict access to people who need them.
Common risks include inconsistent source fields, incomplete records, overly broad access and pipelines that fail to refresh. During implementation, teams also need to reconcile platform definitions and test reports against source data. These checks help prevent a polished dashboard from presenting misleading results.
Common advertising, analytics, CRM, email, social, and sales data sources
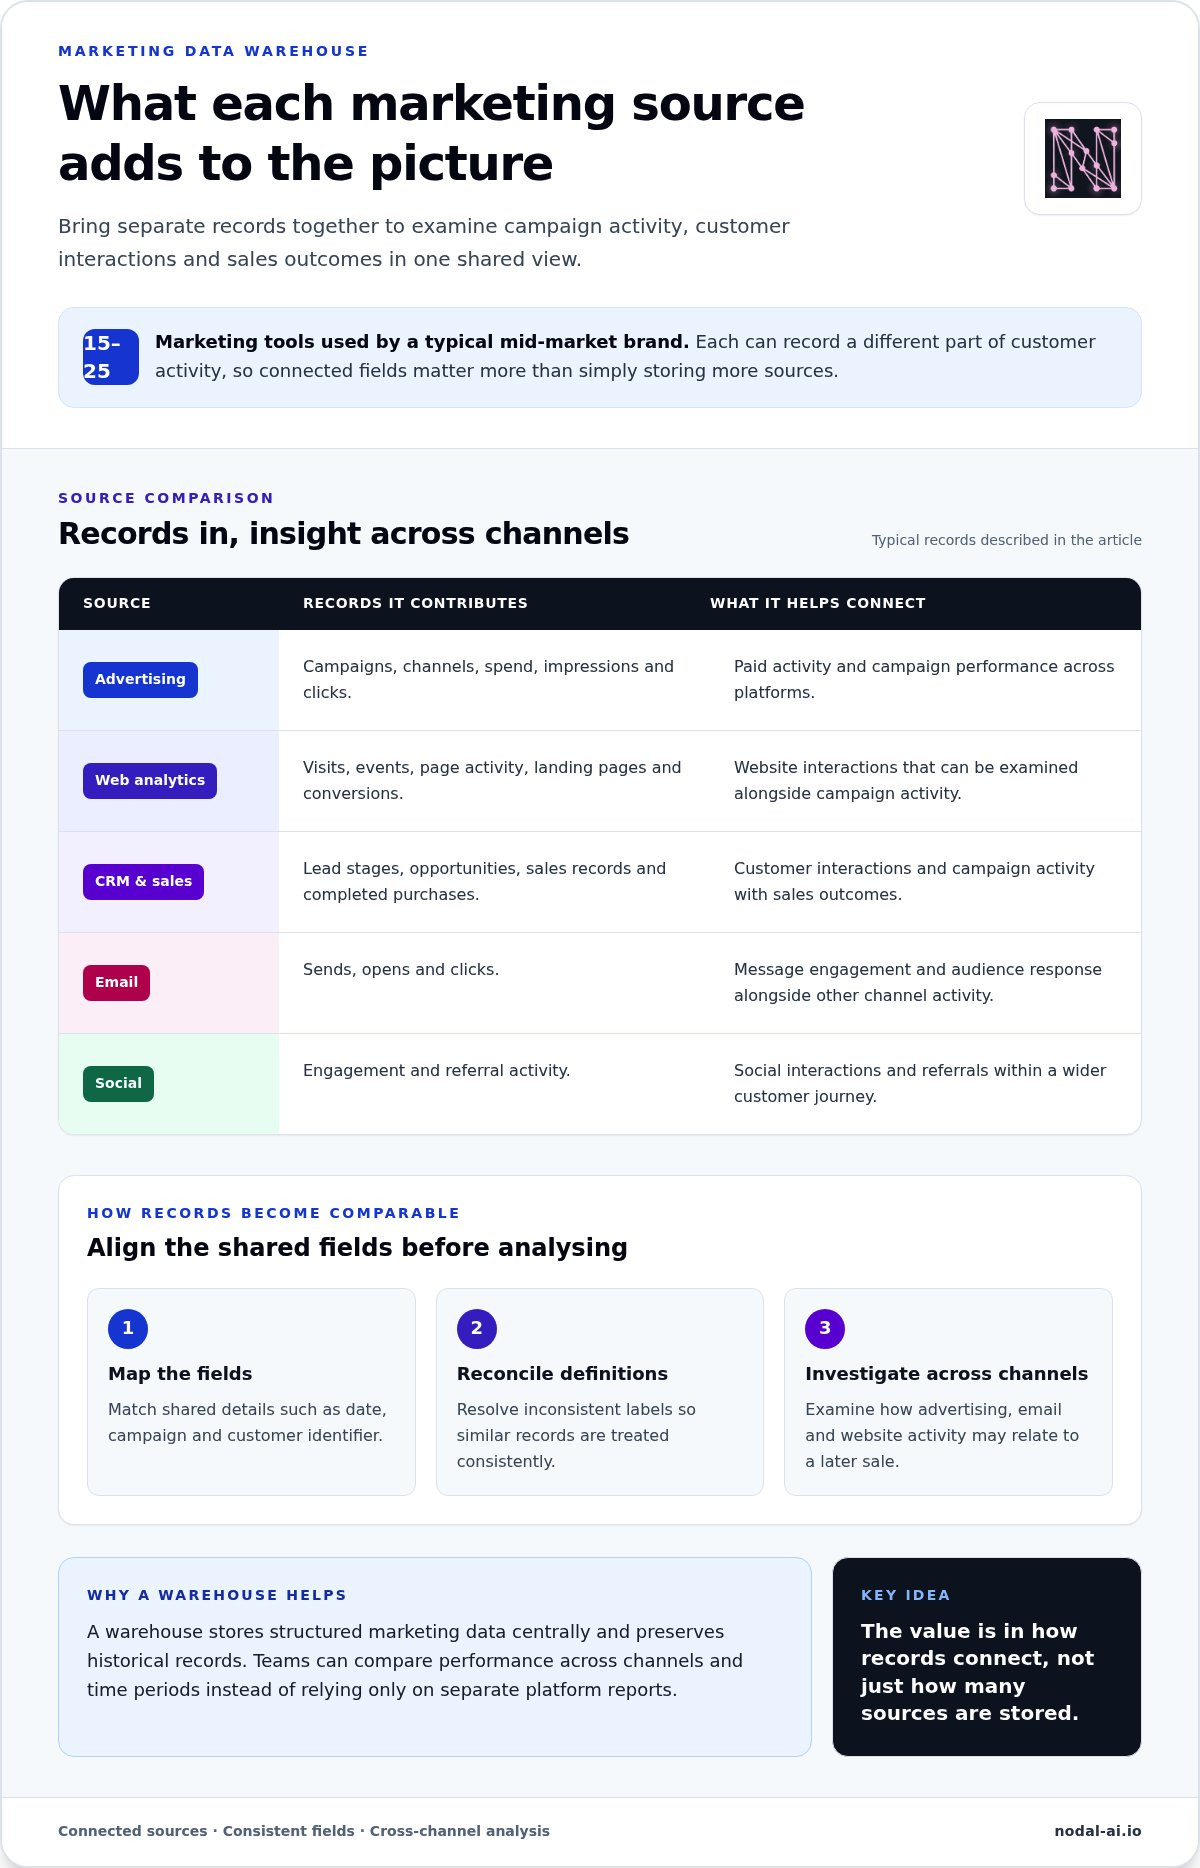
A typical mid-market brand uses 15-25 marketing tools, each recording a different part of customer activity. A warehouse can bring together advertising, web analytics, CRM, email, social and sales data. The useful question is how these records connect, not simply how many sources are stored.
Sources that complete the customer picture
Advertising platforms record impressions, clicks, spend and campaign details. Web analytics tools capture visits, page activity and conversions. Email systems add sends, opens and clicks, while social channels contribute engagement and referral activity. CRM and sales records can connect those interactions to leads, opportunities and completed purchases.
Each source has its own labels and level of detail. One system may identify a campaign by name, while another uses a campaign ID. Before combining them, map shared fields such as date, campaign and customer identifier. This helps analytics queries compare like with like instead of treating similar records as unrelated.
- Advertising: campaign, channel, spend and click records.
- Analytics: visits, events, landing pages and conversions.
- CRM and sales: lead stages, opportunities and purchase outcomes.
- Email and social: message engagement, audience response and referrals.
From separate records to cross-channel analysis
Once connected, these sources can support a more unified view of the customer journey. For example, an analyst can examine whether a recorded sale followed a paid advert, an email interaction and a later website visit. The warehouse provides a shared repository for those records, while agreed identifiers and definitions help show how channels relate.
This view can reveal patterns that isolated reports miss. A campaign may generate few direct purchases yet contribute to later sales through another channel. Cross-channel analysis makes that relationship easier to investigate, provided the source data can be matched and the team uses consistent definitions.
Audience analytics and real-time activation
A warehouse is primarily designed for analysis: teams query stored data to understand audiences, compare channel performance and investigate past activity. Real-time activation, by contrast, uses current customer signals to trigger an immediate action. Customer data platforms can process events in milliseconds to seconds through streaming, while warehouse latency is commonly minutes to hours in batch. The right approach depends on whether the goal is to learn from patterns or respond to an individual event.
Benefits for marketing and analytics teams
Marketing teams can compare channel outcomes using connected campaign and sales records. Analytics teams can establish shared definitions and answer recurring questions from one organised repository. For example, a query can group conversions by campaign and compare them with CRM outcomes, instead of requiring separate reports to be reconciled manually.
For teams mapping how customers move between channels, performance marketing analytics can connect the analysis to practical marketing questions.
Data warehouse comparisons with databases, data lakes, and data marts
A marketing data warehouse, database, data lake, data mart, CDP and CRM each serve different roles. The key differences are the data formats they handle, the tasks they’re designed for and the teams or systems that use their outputs.
How is a marketing data warehouse different from a data lake, CDP and CRM? A warehouse organises structured data for complex analysis, while a data lake can hold structured and unstructured data. A CDP focuses on customer profiles and activation, while a CRM manages customer and sales relationships.
Warehouse versus database and data mart
Traditional databases support quick queries and transaction processing, such as recording an order or updating a customer account. Warehouses are built for complex analysis, such as comparing campaign metrics across channels and historical periods. Separating analytical processing from live transactions lets each system perform its distinct role.
A data mart is a focused collection of data for a specific team or purpose. For example, a marketing data mart might contain campaign and conversion metrics, while a broader warehouse also supports finance or sales analysis. A mart can make a relevant dataset easier to use, but it covers less than an enterprise warehouse.
Warehouse versus data lake and lakehouse
A traditional warehouse works with structured data, organised into defined fields and tables. Data lakes can store structured and unstructured material, including event records and text. They support batch and real-time processing, with scalable storage that can be cost-effective. Their lower initial cost can change as the volume and complexity of use grow.
The formats supported by warehouses, lakes, and lakehouses can vary, so teams should check compatibility with their needs. A lakehouse combines elements of both, pairing a lake’s range of data with warehouse-style analysis. Its cost profile is moderate, balancing cost and performance. The best fit depends on whether teams need governed analytical tables, flexible raw storage or both.
Warehouse costs are generally higher because the system is optimised for performance. Scaling traditional warehouses can involve higher costs. Cloud warehouses can scale storage and computing resources independently, which may help match capacity to changing analytical workloads.
Where CDPs and CRMs fit
A CRM, such as a system used to manage lead stages and sales relationships, helps teams act on customer records. A CDP brings customer data together to support audience activation, often with streaming latency measured in milliseconds to seconds. A warehouse instead supports deeper queries across structured records, usually through batch processing. These systems can complement rather than replace one another.
Choose by starting with the task: use a database for transactions, a warehouse for cross-system analysis, a data lake for varied formats and a mart for a focused dataset. Add a CDP when audience activation is central, or a CRM when managing customer relationships and sales activity is the priority.
Business intelligence, reporting, and dashboards
Business intelligence turns warehouse data into reports, visualisations and analysis that support decisions. A marketing team might use a dashboard to compare channel performance, while enterprise leaders review how marketing outcomes relate to sales.
Reporting that supports decisions
Reports answer defined questions; dashboards make key measures easier to monitor. For example, a report can compare subscription totals between April and May, while a dashboard tracks subscriptions, campaign spend and conversions together. One market example shows a 20% drop in subscriptions in May compared with the previous month. Joined-up reporting helps teams investigate whether the change aligns with shifts in channel activity.
About 62% of marketers use built-in marketing or CRM software for reporting. Those tools can serve routine needs, but separate platform reports may define measures differently. A warehouse-backed business intelligence layer can apply shared metric definitions, then present comparable results across systems. That makes it easier to distinguish a genuine performance change from a difference in reporting methods.
Signals that a business may need a warehouse
Look for recurring reporting friction, not simply a growing technology stack. A warehouse may help when teams regularly combine exports by hand, spend time reconciling conflicting totals or can’t connect marketing activity with sales outcomes. For instance, if campaign and CRM reports show different conversion totals, analysts need to trace the definitions and records behind both figures.
Another signal is that leaders need answers across channels or periods, but each request requires a separate data pull. A warehouse creates a shared analytical foundation, allowing business intelligence tools to use consistent data. It’s less compelling when existing reporting already answers recurring questions without manual work or conflicting measures.
Visualisation and business-wide visibility
Visualisation makes patterns easier to spot, but a chart is only as useful as its measures. A line chart could show weekly leads; a table might explain which channel contributed to each total. Pair each view with a clear definition, timeframe and source so marketing, sales and finance interpret the same figure consistently.
For wider visibility, design dashboards around the decisions different teams make. Marketing may need campaign and conversion detail, while finance may focus on spend and revenue. A shared dashboard can provide both views using the same underlying definitions, with access tailored to each audience. This reduces the risk of teams presenting conflicting results.
Build dashboards around the questions
Start with the decisions a dashboard should support, then choose the measures and visual form. A useful rule of thumb is to cover approximately 80% of a marketing team’s data needs with pre-built dashboards, helping prevent the analytics team from becoming a bottleneck. Keep the remaining analysis flexible for new questions that need investigation.
- Monitor: show recurring measures, such as conversions by channel.
- Explain: include the timeframe and metric definition behind each chart.
- Investigate: let analysts explore exceptions, such as an unexplained fall in leads.
This structure turns reporting into business intelligence: teams can monitor results, understand changes and focus analysis where it matters.
Choosing and evaluating a marketing data warehouse
Choose a warehouse by starting with the decisions it must support, then testing the systems and data behind them. A platform may look capable in a product demonstration yet struggle with your structured data, historical records or campaign reporting needs. Evaluate the whole process, from source connection to business query.
Match the warehouse to the work
List the questions marketing and finance need answered. For example, can analysts compare campaign spend with sales outcomes across channels and past periods? Map each question to its data sources, required fields and update frequency. This reveals whether the warehouse’s structure suits your actual workloads, rather than an abstract feature checklist.
Check how the system handles structured data and agreed schemas. Consistent naming conventions help teams compare records across channels. A campaign called “Spring Search” in one source and “SS-01” in another needs a reliable mapping. Test whether those rules can be maintained as sources and reporting needs change.
Assess performance, scale and total cost
Test representative queries using realistic data volumes and reporting requirements. A warehouse optimised for analytical performance generally costs more, while traditional warehouse scaling can become exponentially more expensive because of vendor costs. Cloud warehouses can scale storage and computing resources independently, which may help teams align capacity with changing workloads.
How much does a marketing data warehouse cost? There’s no single price: total cost depends on storage, computing, data movement, integrations, retention and query activity. Compare these cost drivers with the historical data and reporting capacity your campaigns require, then consider how usage may change the total over time.
Compare platforms and supporting tools
Popular warehouse platforms and tools include cloud data warehouses, data integration tools and business intelligence software. The warehouse stores and serves prepared data; integration tools move and transform it, while BI tools turn it into reports. SQL is commonly used to query warehouse data. Evaluate how these components work together, not just the warehouse in isolation.
During a pilot, connect representative sources and follow one campaign metric from its origin to a dashboard. Check that transformations preserve meaning, historical records remain usable and teams can reproduce the result with a documented query. This can expose gaps that a feature list won’t show.
Review governance and operational fit
Define who can access sensitive data, how long records remain useful and who owns each metric. These choices affect trust in reporting and the effort required to maintain the warehouse. Ask teams to test everyday tasks, such as correcting a campaign label or updating a shared definition.
Choose the option that answers priority questions with consistent data, manageable operations and clear scaling behaviour. If connected marketing analysis is a priority, explore a marketing analytics demo.
Nodal AI: Nodal Platform
Nodal AI’s Nodal Platform is a natural next step when disconnected marketing data makes performance hard to understand. Its Performance Marketing Analytics helps businesses assess results, while Growth Recommendations turn analysis into practical areas to consider. Automated Reporting can also make marketing performance clearer and more consistent.
Use these capabilities when your team needs to connect performance insights with decisions, rather than manage reporting in isolation. They complement a marketing data warehouse by helping teams interpret marketing data and identify opportunities for growth.
Visit nodal-ai.io to learn more about Nodal AI.
Turn your data strategy into a clear next step
Understanding what a marketing data warehouse can do is only the starting point. Next, decide which business questions need clearer answers, who needs those answers and how your organisation will act on them. Start with a decision that currently relies on disconnected reports, then define what evidence would make it more confident.
That focus keeps technology choices tied to real work. It also gives marketing and analytics teams a shared purpose: make data useful, not simply collect more of it. As priorities evolve, revisit the questions and measures your systems need to support.
Bring your most important questions forward and build a clearer path from marketing data to action.
Frequently Asked Questions
What is a marketing data warehouse?
A practical way to understand what a marketing data warehouse is: it gives analysts a shared environment to query marketing records. For example, a retailer could compare campaign activity with later purchases, then segment results by product or region. The warehouse supports that analysis; it doesn’t decide which campaign deserves more investment. Teams still interpret the findings alongside their goals and other business evidence.
What data sources are commonly included in a marketing data warehouse?
Common sources include advertising and web analytics platforms, CRM records, email engagement, social activity and sales transactions. For example, Meta Ads and Google Analytics can contribute campaign and site activity, while a CRM adds lead or customer stages. Choose sources based on the question: measuring lead quality needs sales or CRM outcomes, while comparing landing-page engagement calls for website analytics.
What are the benefits of a marketing data warehouse for analytics and attribution?
A warehouse gives analysts a place to compare channel activity with downstream outcomes and apply attribution methods to connected records. For instance, a team could examine whether paid search, email or social interactions appeared along customer journeys ending in a sale. Attribution describes how a model assigns contribution; it doesn’t prove that a touchpoint caused the purchase. State the model and its assumptions beside the result.
How do you build a marketing data warehouse step by step?
Start by defining a business question, such as which campaigns bring qualified leads. Select the sources that can answer it, then map shared identifiers and metric definitions. Build the data flow into the warehouse and test sample records against their original systems. Finally, publish a report for the people making the decision. Document ownership and definitions so later changes don’t quietly alter how results are interpreted.
What data privacy and security rules apply to marketing data warehouses in the United States?
Obligations depend on the data, the people it concerns and the organisation’s activities. Design controls for access, retention and permitted use, protect sensitive records and restrict access to people who need them.


