

Campaign activity matters when it leads to measurable progress. Marketing analytics for financial services connects campaign, channel and customer data to show which efforts contribute to business outcomes, where performance can improve and how to support customer growth. It turns fragmented signals into a clearer picture of what is working.
Financial marketing often involves long customer journeys and decisions shaped by multiple interactions. Reviewing campaign results in isolation can leave important gaps. A connected view helps teams understand how channels and customer behaviour relate to outcomes.
This article explains what marketing analytics means in financial services, how it measures campaign effectiveness and returns, and how insights can guide performance improvements and growth. It also explores how customer analytics, attribution and predictive modelling make complex data more useful for decision-making.
Key Takeaways
- Connect customer and campaign data to understand how financial marketing influences acquisition and retention.
- Use attribution to see how different interactions contribute to conversions, rather than judging campaigns by a single touchpoint.
- Choose performance measures that link campaign activity to returns, customer behaviour and business goals.
- Turn reporting into action by identifying what to refine, where to focus and which customer opportunities to explore.
- Use analytics tools such as Nodal Platform when fragmented data makes it harder to uncover useful insights and support growth.
How Is AI Redefining Customer Acquisition and Retention in Financial Services?
AI can help financial teams use customer and campaign data to make acquisition more relevant and retention more proactive. Its value lies in connecting signals to decisions: which audience to reach, what need to address and when to respond.
Customer Acquisition and Retention
Analytics supports acquisition and retention by showing which customer groups respond to an offer and which may be disengaging. A bank could compare responses from first-time mortgage applicants and existing current-account holders, then tailor communications to each segment. Relevant messaging can support engagement, while a poorly timed or mismatched offer may be ignored. Teams can measure both new-account activity and existing-customer responses.
Customer Data and Emerging Needs
Customer analytics examines information such as account activity, product use and engagement to identify patterns that may signal changing needs. For example, a credit union might notice a customer regularly using a savings account while exploring home-buying content. This combination could inform a timely mortgage message, in line with the institution’s data permissions and communication practices. Behavioural segmentation helps teams connect observed needs with relevant products, rather than relying only on broad demographic assumptions.
Attribution Across Customer Journeys
Marketing attribution assigns credit to interactions that contribute to a customer’s decision, rather than treating the final click as the whole story. A prospective customer might see a search advertisement, read a financial education email and later visit a branch before applying for a loan. Reviewing those touchpoints together helps marketers understand how channels contribute at different stages. Customer journey mapping makes these paths easier to interpret and can reveal where engagement drops.
Marketing ROI and Acquisition Costs
Marketing return on investment compares campaign value with campaign spend, while customer acquisition cost measures the spend associated with gaining customers. A bank can assess a credit-card campaign by connecting advertising and communication costs with completed applications and opened accounts. Consistent definitions make it easier to compare campaigns. Teams can then investigate whether changing a channel, audience segment or message improves results, instead of increasing spend based on clicks alone.
AI can help flag customer behaviour that differs from usual patterns. For example, a sudden fall in mobile-banking logins, email engagement or recurring deposits may prompt a retention team to review the account journey. Predictive models use historical patterns to estimate churn risk, helping staff prioritise appropriate follow-up. The useful signal is not a prediction on its own, but a specific change that informs a relevant, timely response.
To act on these insights, connect campaign outcomes with customer journeys and product activity. Compare acquisition sources, review engagement by segment and investigate where customers stop responding. This makes analytics a practical input to campaign planning and retention decisions, rather than simply a retrospective report.
What Is Marketing Analytics for Financial Services?
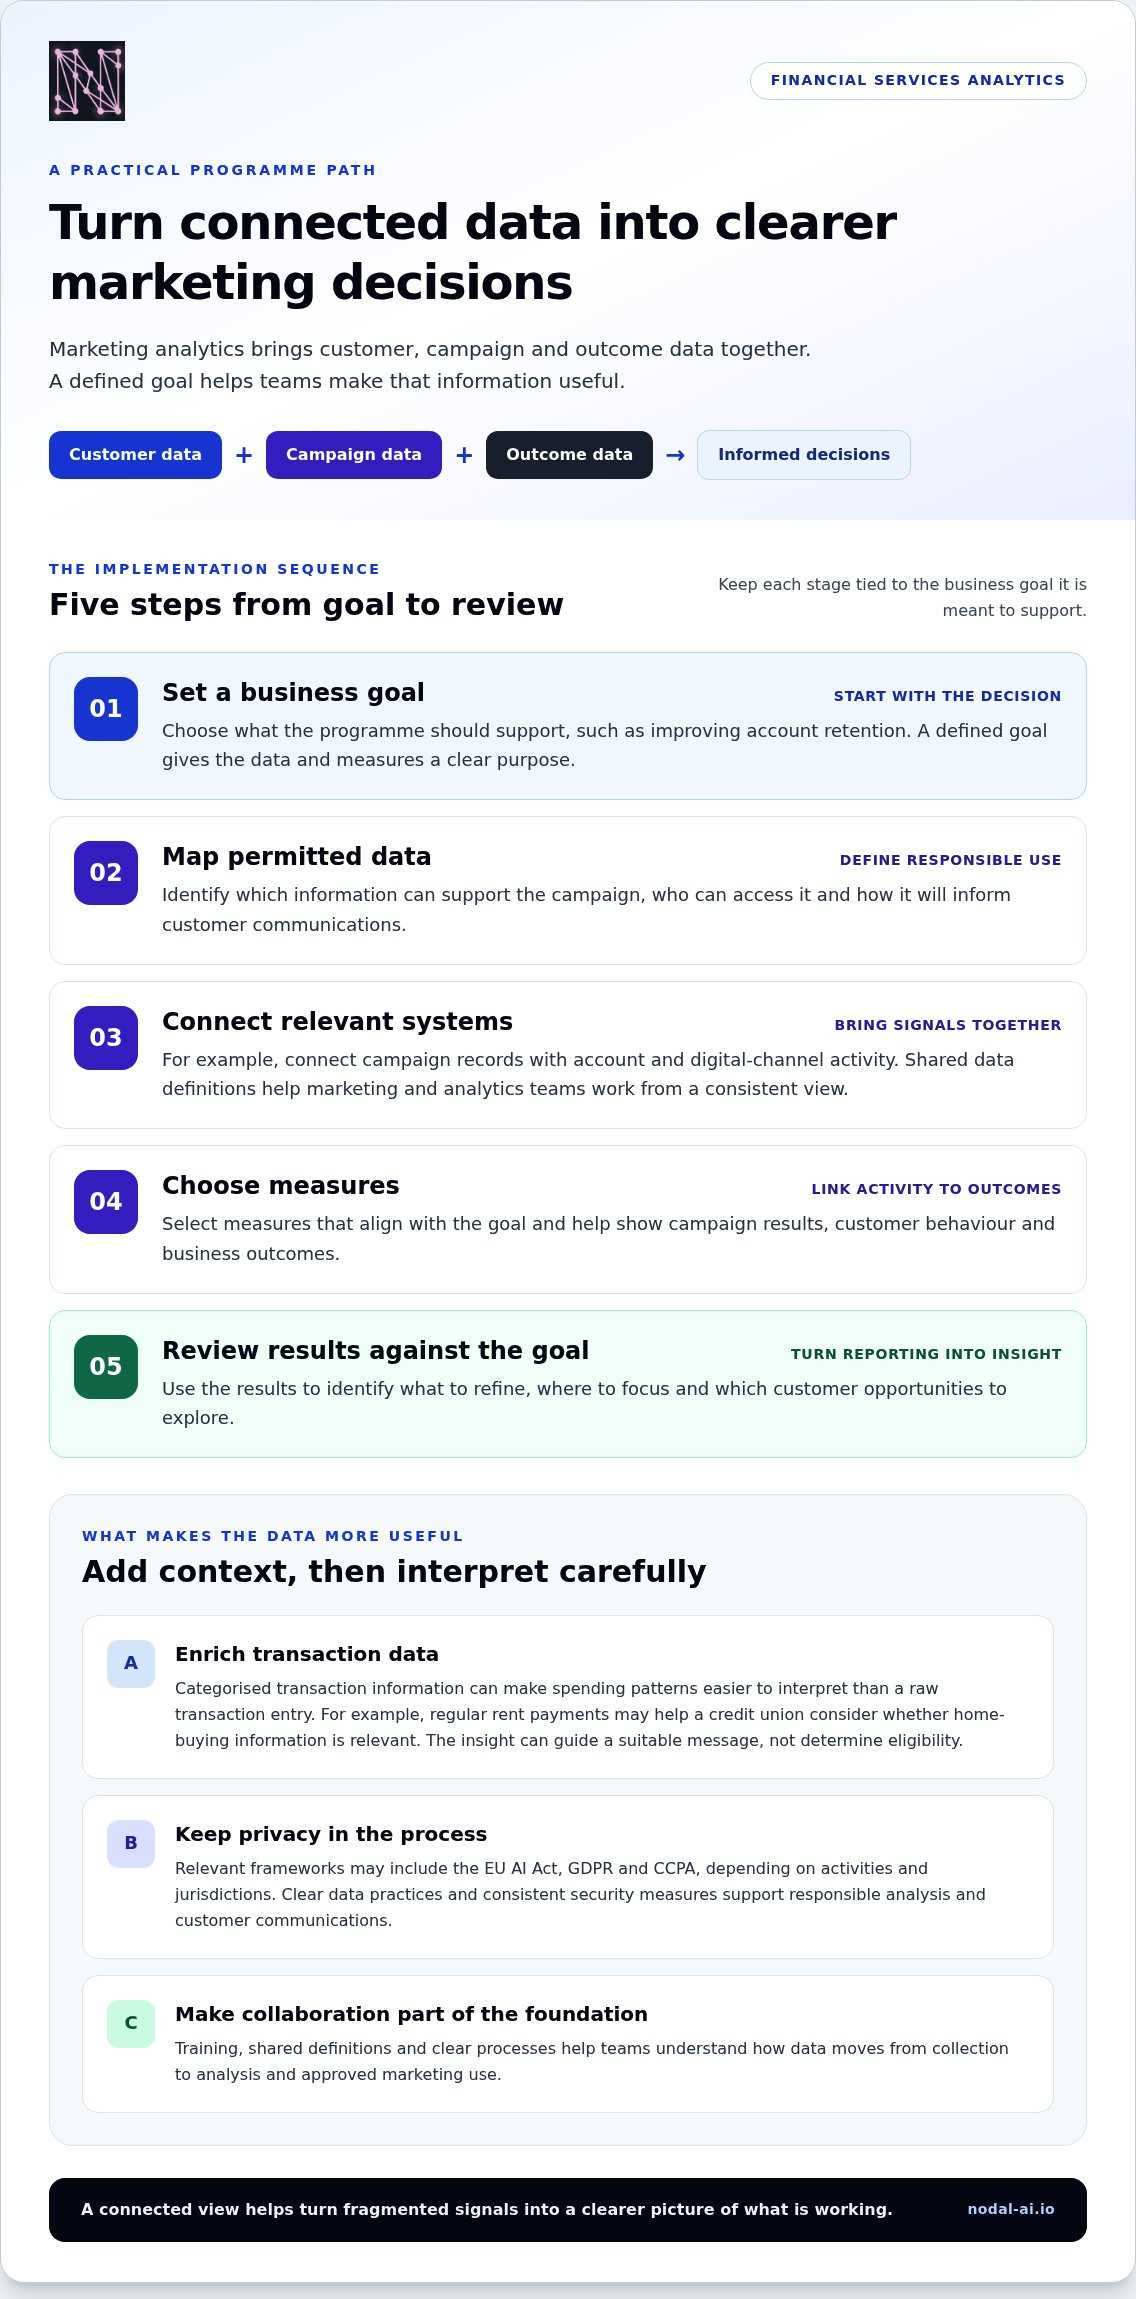
Marketing analytics combines customer, campaign and outcome data to inform financial institutions’ marketing decisions. To implement a programme, set a business goal, map permitted data, connect relevant systems, choose measures and review results against that goal.
Data-Driven Strategy for Financial Institutions
A data-driven strategy uses evidence from customer interactions and campaign outcomes to shape marketing decisions. For a bank or credit union, this means aligning a goal, such as improving account retention, with relevant measures and customer information. Without a defined goal, teams may collect data without knowing which decisions it should inform.
The right infrastructure makes this process workable. A bank might connect campaign records with account and digital-channel activity, then establish shared data definitions across marketing and analytics teams. Training and collaboration support data-led decision-making. Clear processes also help teams understand how data moves from collection to analysis and approved marketing use.
Transaction Data and Behavioral Insights
Transaction enrichment adds context to account transactions, making spending patterns easier to interpret. A raw transaction entry may offer little insight, but categorised information can reveal recurring spending, changing behaviour or potential product needs. Financial institutions can use these patterns to shape relevant services and messages instead of making broad assumptions about account holders.
For example, a credit union could identify members with regular rent payments and consider whether home-buying information may be relevant. The insight should guide a suitable message, not determine eligibility. Connecting enriched transaction data with campaign responses also helps teams understand whether their communication addressed a customer need.
Privacy and Regulatory Constraints
Privacy shapes which data financial institutions can use and how they use it. The EU AI Act, GDPR and CCPA are among the frameworks marketers may need to consider, depending on their activities and jurisdictions. Clear data practices help teams define what information supports a campaign, who can access it and how it informs customer communications.
For example, a bank analysing account activity for campaign insights should pair its data strategy with consistent security measures. Teams also need clear internal processes for handling customer information. These foundations connect useful analysis with responsible use, rather than making privacy a final review after campaign decisions are made.
First-Party Data and Privacy-First Analytics
First-party data is information an institution collects through its own customer relationships and channels. Examples include account interactions, responses to bank communications and activity within digital banking. These signals can help teams understand behaviour within a direct relationship, with data collection and use tied to defined purposes.
Start with information relevant to a specific marketing question, then limit analysis to that purpose and protect access. For example, a credit union evaluating an email campaign can compare responses with its own customer records. A performance marketing analytics approach can help connect campaign activity with business outcomes.
Measuring campaign effectiveness and returns
Measure campaigns against defined business outcomes, not activity alone. A clear baseline helps financial teams connect marketing actions with results.
Campaign Effectiveness Measurement
Campaign effectiveness measurement compares results with a defined objective, such as completed applications or funded accounts. It matters because clicks and opens show activity, while customer actions reveal whether a campaign contributed to its goal. McKinsey reports that personalisation increases return on investment by 10-30%, making relevance one factor worth measuring alongside channel, audience and outcome.
Start by recording campaign costs, the intended audience and the outcome that counts as success. For a savings campaign, that might mean measuring eligible account openings rather than page visits. Compare results with a baseline, then calculate return by subtracting campaign cost from the value attributed to the campaign and dividing by that cost.
Campaign Testing and Optimization
Campaign testing compares versions of a message or delivery approach to learn which better supports a chosen outcome. It matters because teams can use observed responses to refine future communications rather than relying on preference or assumption. Tech Report found that 59% of companies conduct email A/B testing, illustrating how marketers use controlled comparisons to evaluate campaign choices.
A financial institution could test two subject lines while keeping the audience, offer and sending conditions consistent. Before launch, define the success measure, such as completed appointment bookings, then compare outcomes after the test. Change one meaningful element at a time to make it easier to connect performance differences with the change that may have caused them.
Campaign Performance Analysis
Campaign performance analysis interprets results across channels, audiences and outcomes to explain what influenced performance. It matters because a strong overall result can hide weak audience response or an inefficient channel. A useful review separates awareness, engagement and conversion measures, then connects each to the campaign’s objective and relevant customer actions.
Compare like with like by reviewing similar audiences, campaign periods and outcome definitions. If a card campaign generates many enquiries but few completed applications, examine where prospects stop progressing. Track cost per completed application alongside response volume to distinguish attention from value. Record the change made and its subsequent effect to build a clear learning record.
Privacy changes can affect measurement choices. Ninety percent of marketers reported that recent privacy changes affected how they measure marketing efforts and campaigns. Financial teams should record which data supports each metric and identify gaps in channel reporting. If an interaction cannot be observed, note that limitation in the analysis rather than treating missing activity as proof that it had no influence.
Attribution also shapes reported returns. A position-based model can assign 40% credit to the first touch, 40% to the last touch and 20% to interactions between them. Compare that view with other attribution approaches before shifting campaign investment. The model is an allocation method, not proof that a channel independently caused a conversion.
Turn findings into specific actions: retain effective campaign elements, revise weaker ones and define what the next measurement will test. McKinsey’s personalisation finding gives teams a reason to examine message relevance, while campaign-level results show whether it supports valued outcomes. Keep the objective, cost basis and measurement method visible in each review so decision-makers can interpret returns consistently.
Marketing analytics and performance improvement
Performance improves when marketing teams connect brand activity with measurable business outcomes. A clear KPI framework helps leaders turn tracking into intelligence and use it to make focused decisions.
Brand marketing builds awareness and trust; performance marketing tracks actions such as enquiries or applications. Analytics can connect these views by showing how exposure and engagement relate to later customer activity. For example, a financial institution could compare branded search interest with completed account applications across campaigns. This helps teams avoid judging brand investment only by immediate conversions or performance activity only by clicks.
Start with a shared business objective, then select measures for each stage. A campaign to increase awareness might track reach and branded searches, while an application campaign measures completed applications and their associated cost. Keep definitions consistent across platforms. If one team counts enquiries and another counts opened accounts, leaders cannot compare results or clearly see where performance changes.
Financial-services marketing dashboards should track 8 to 12 core KPIs. Choose measures that cover campaign delivery, audience response, conversion and business outcomes. An executive dashboard can then highlight 3 to 5 metrics, giving leaders a concise view without hiding the underlying detail. For instance, a bank might surface application volume, conversion rate and cost per account, while keeping channel-level measures available for deeper analysis.
Cadence matters. A weekly executive summary of the top 3 to 5 metrics can flag emerging changes, while monthly full-dashboard reviews with the leadership team provide space to investigate causes and agree actions. Compare performance with the campaign objective and prior results, not isolated platform benchmarks. If application volume rises but completed accounts do not, review the customer journey and conversion process before increasing campaign activity.
Cross-channel visibility supports better decisions. Ninety eight percent of marketers understand the importance of a complete, centralised view of cross-channel marketing. Yet platforms may define impressions, conversions and attribution differently. Bring measures into a consistent reporting view, record their definitions, and separate observed results from estimated contributions. This gives teams a clearer basis for refining creative placement, audience selection or channel investment.
For organisations spending at least $1M annually on marketing, evaluating marketing mix modelling can add a broader view of channel contribution. It can complement campaign tracking when teams need to assess combined activity, rather than relying only on individual interactions. Use it alongside operational measures, then relate findings to the organisation’s goals. The key is not adding another metric, but choosing evidence that changes a decision.
Finally, turn each review into a specific action: retain what supports the goal, investigate weak points and record what changes next. Outbound email volume rose 15% in the past year, making it especially useful to assess whether added sends contribute to meaningful outcomes. A disciplined KPI structure helps leaders distinguish more activity from better performance.
Marketing analytics and business growth
Growth comes from using marketing intelligence to guide investment towards valuable customer relationships and relevant opportunities. Alkami research found that the most digitally mature financial institutions saw twice the revenue growth of the least mature institutions. Analytics helps turn that advantage into decisions about customer value, product adoption and channel priorities.
Customer lifetime value gives teams a longer view than a single campaign outcome. It estimates the value of a customer relationship over time, helping leaders compare acquisition opportunities with retention and product engagement. Gartner identifies customer lifetime value analysis as one of the top five marketing techniques used by 25% of marketers. For a bank, this lens can help distinguish a short-term response from a relationship with broader potential.
Consider a customer who holds a current account but borrows from another provider. With appropriate data, a financial institution can identify external accounts, balances and interest rates, then use those patterns to inform product roadmaps and targeted messaging. This can support relevant cross-sell decisions, while customer behaviour helps show whether the product or message addresses an actual need.
Growth analysis helps teams assess where channel investment may create value. Compare customer response, product adoption and longer-term account activity by channel, then consider whether differences reflect audience fit, offer relevance or the customer journey. A bank, for example, might find that one channel brings more initial enquiries while another leads to stronger ongoing use. That distinction can shape future investment without treating every conversion as equally valuable.
Personalisation can connect those insights with revenue outcomes. McKinsey reports that personalisation increases revenue by 5-15%. For a credit union, this could mean using product adoption and financial behaviour to tailor relevant communications, then measuring subsequent engagement and uptake. The practical lesson is to use analytics to improve relevance, not simply to increase message volume.
To measure growth, define the outcome before changing a campaign or channel allocation. Track customer value, product adoption and retention against that goal, then review whether the observed change supports the intended business result. If an offer increases uptake but weakens long-term engagement, the apparent gain may not support durable growth. Clear measures help leaders recognise the difference and adjust investment accordingly.
Analytics can help identify products that deserve further development. When aggregated customer patterns reveal repeated unmet needs, teams can connect those signals with product usage and campaign response. For instance, several customer segments may show demand for clearer borrowing information, prompting a financial institution to refine its product roadmap and test more relevant communications. Link customer evidence with product and marketing decisions, then assess the resulting growth.
Explore growth analytics
Nodal AI: Nodal Platform
Nodal AI’s Nodal Platform helps financial services teams turn fragmented marketing data into clearer insights for decision-making. Its Performance Marketing Analytics, Growth Recommendations and Automated Reporting help teams connect campaign performance with growth priorities. Consider the platform when separate data sources or manual reporting make it harder to understand what contributes to outcomes.
Use these insights to assess campaign performance, understand customer journeys and identify opportunities to improve. Nodal Platform offers a more connected view to inform marketing decisions. Contact Nodal AI to discuss your analytics needs.
Make Your Next Marketing Decision Count
Choose an upcoming marketing decision as the starting point for stronger analytics. Define the outcome that matters, identify the customer and campaign signals that can inform it, then agree how the team will assess the result. A focused use case gives marketing, data and business leaders a shared reason to connect their work.
Build a repeatable learning loop: review the evidence, record the decision it supports and apply what you learn to the next campaign. This keeps marketing analytics for financial services tied to real choices, rather than dashboards that simply collect activity. As the process develops, teams can expand it around the questions with the clearest value for customers and the business.
Progress starts with a clearer view of what to do next. Nodal AI can help your team turn analytics priorities into action.
Bring the next decision into focus and give your team a clearer path forward.
Frequently Asked Questions
What Attribution Models Work for Long Financial Sales Cycles?
Position-based, linear, time-decay and first-touch models can each help analyse long financial sales cycles. Choose according to the decision you need to make: first-touch highlights discovery, while time-decay gives more credit to later interactions. A linear model distributes credit evenly across recorded touchpoints. Compare models using the same conversion definition, and treat their outputs as allocation methods, not proof that one interaction caused a sale.
What tools are commonly used for marketing analytics?
Marketing analytics teams commonly use customer relationship management systems, campaign platforms, web analytics, attribution tools and business intelligence software. Each has a different role: campaign platforms capture delivery and response, CRM systems hold customer and sales activity, and reporting tools bring measures together. Financial firms should assess whether these systems connect relevant records, preserve consistent definitions and support the marketing decisions they need to make.
What types of data are used in marketing analytics?
Marketing analytics can use campaign delivery, web and app interactions, customer records, transactions, product use and conversion outcomes. A lender, for example, could compare an advertisement response with a loan application’s progress, then review the channels and customer interactions associated with that outcome. Use data relevant to the question, and distinguish observed customer actions from inferred interests or modelled predictions.
Why are marketing analytics important for businesses?
Marketing analytics helps businesses choose actions using evidence about customer responses and commercial outcomes. A financial firm might find that an information campaign generates enquiries but few completed applications. This can prompt a review of the application journey instead of simply increasing campaign distribution. Analytics also gives marketing and leadership teams a shared basis for prioritising investment, evaluating decisions and learning from results across customer groups.
What is marketing analytics in financial services?
Marketing analytics in financial services uses marketing and customer data to understand performance and inform decisions. It connects campaign activity with outcomes such as account openings, policy enquiries or digital product use. For example, a fintech company can compare onboarding messages with customer progress through registration. This helps teams identify where communication supports a business objective and where the customer experience may need attention.
What marketing KPIs should banks, insurers, and fintech companies track?
Track KPIs that match each organisation’s goals and customer journey. Banks could monitor qualified account applications and funded accounts; insurers could examine quote-to-policy conversion and renewal engagement; fintech firms could track completed onboarding and active product use. Useful measures across sectors may include channel response, conversion rate, cost per acquisition and retention. Define each metric consistently so teams can interpret changes without confusing activity with business outcomes.
What are the leading marketing analytics platforms for financial services, and how do they compare?
Compare platforms by how well they connect marketing data, measure customer journeys and support decisions, rather than by feature count alone. Some tools focus on campaign reporting; others combine attribution, journey analysis and predictive modelling. Nodal Platform brings together analytics, Performance Marketing Analytics, Multi-Touch Attribution, Customer Journey Mapping and Predictive Modelling. The right fit depends on the questions your team needs to answer and the data it needs to connect.
How can financial firms measure marketing campaign ROI and customer acquisition cost?
Calculate campaign ROI by subtracting campaign spend from the value attributed to its outcomes, then dividing the difference by spend. Calculate customer acquisition cost by dividing relevant acquisition expenditure by the number of acquired customers within the same measurement scope. Before comparing channels, a bank should align the campaign period, included costs and customer definition. Record attribution assumptions, since different credit rules can change reported returns.


