

Conversion patterns can do more than explain past performance. They can help sales teams prioritise leads most likely to become customers. Lead scoring with predictive analytics uses historical and current lead data to identify signals associated with conversion, then ranks prospects by their likelihood to convert. Unlike traditional scoring, which assigns points manually, predictive scoring learns from patterns across successful and unsuccessful leads.
It’s understandable to want a clear way to distinguish strong buying signals from casual engagement. A high score is most useful when teams can see what influenced it and treat it as guidance, not a substitute for sales judgement.
Learn which data predictive scoring uses, how conversion patterns shape lead priorities, and how it differs from traditional scoring. We’ll also explore why explainability, data quality and regular review matter when turning model scores into practical decisions.
Key Takeaways
- Learn how historical and current lead signals can reveal patterns linked to conversion.
- See why understanding the factors behind a score helps teams use model predictions with confidence.
- Explore how conversion patterns can help sales teams prioritise promising leads.
- Compare manually assigned points with scoring informed by machine-learning analysis.
- Discover how connected, reliable data supports more useful lead prioritisation.
Predictive Lead Scoring: What Does It Do & How Can You Use It in Your Analytics?
Predictive scoring analyses past outcomes and current activity to rank leads by their likelihood of becoming customers. It helps sales teams spot conversion patterns that manual rules may miss.
Historical and Real-Time Data
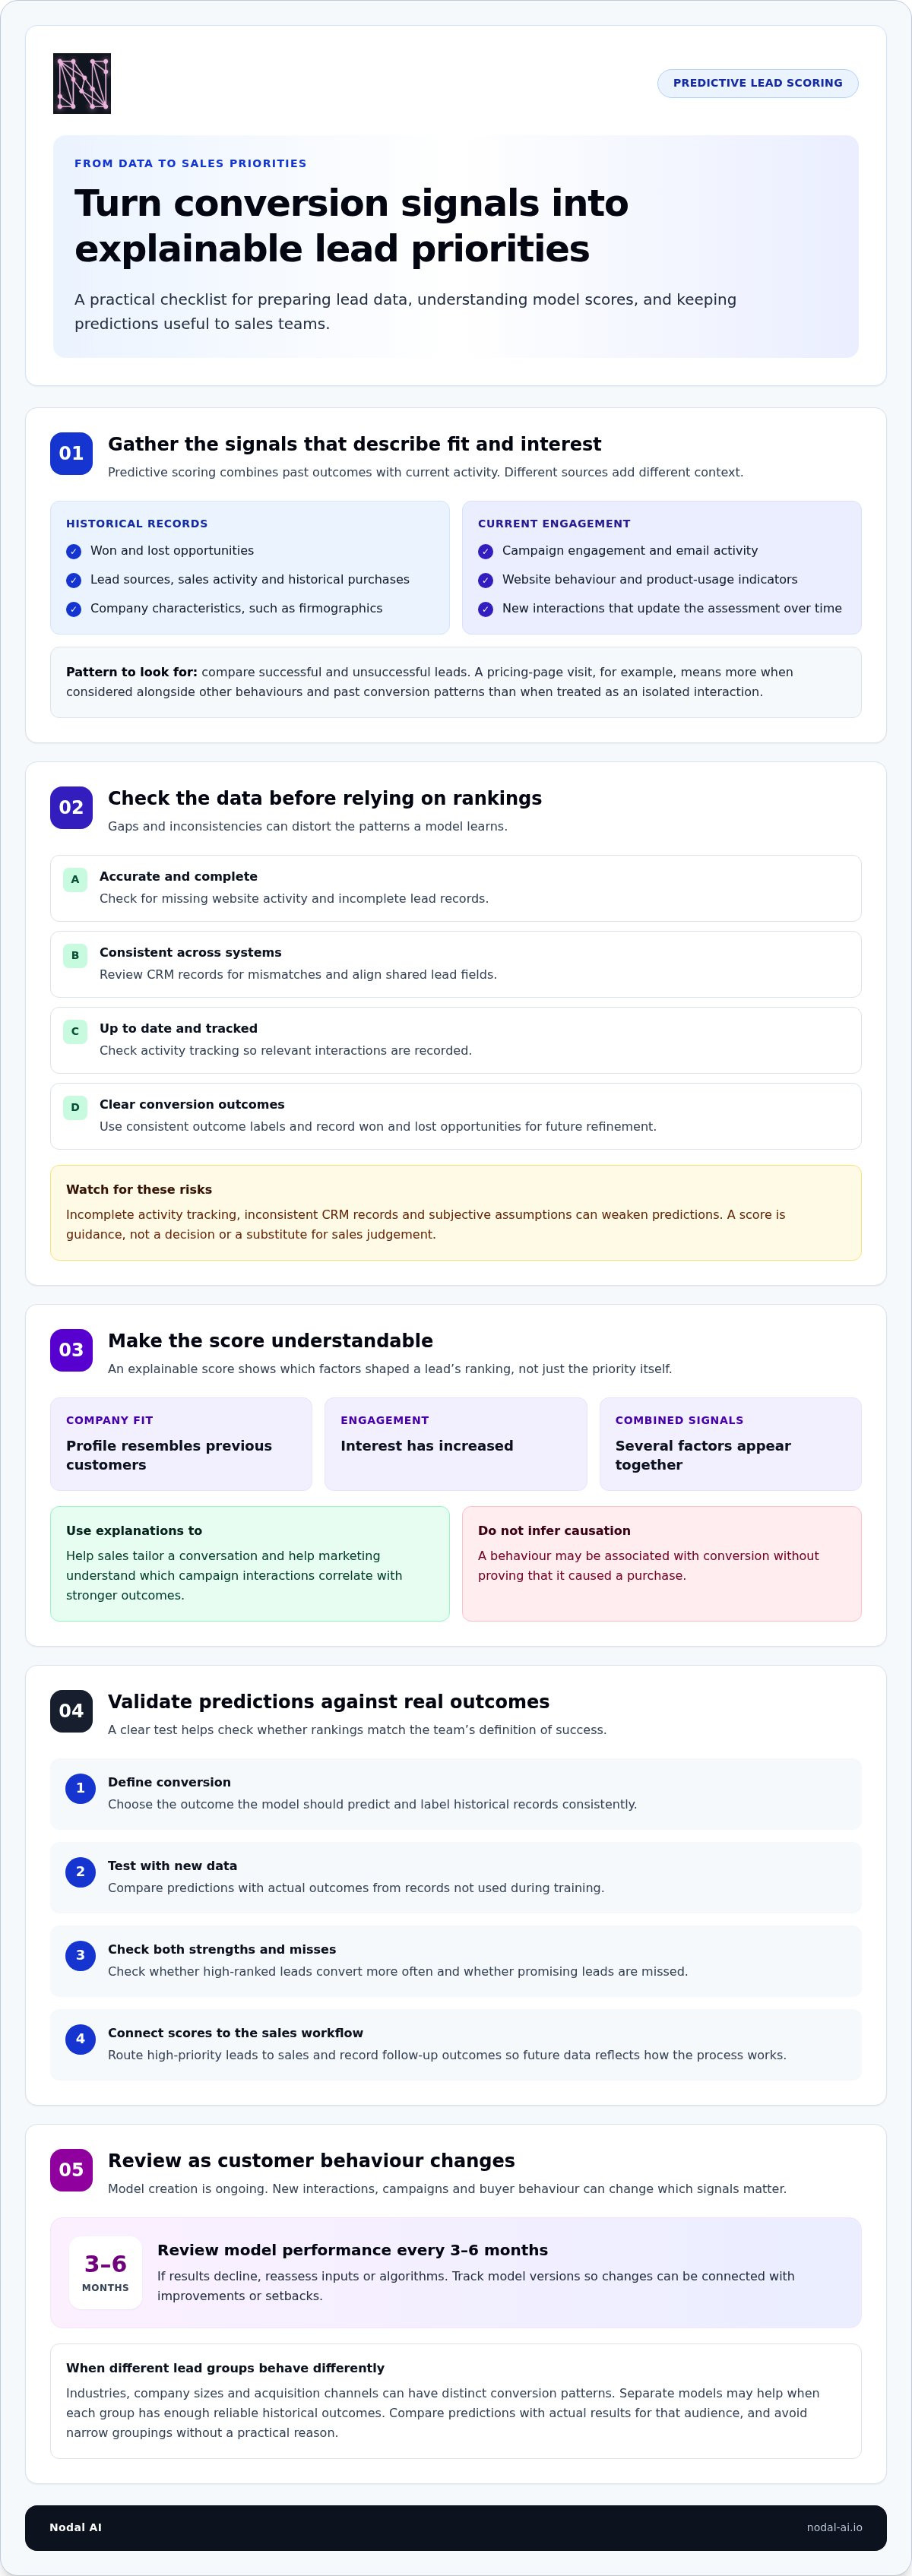
Predictive scoring combines historical lead records with current engagement signals to estimate which prospects are most likely to convert. Past records show how won and lost opportunities behaved, while current activity adds context as prospects interact with a business.
For example, a technology-company lead who visits a pricing page five times within a week and downloads a software-migration whitepaper shows stronger buying signals than someone who only opens a newsletter. The model compares these behaviours with past conversion patterns and updates its assessment as new interactions arrive. This helps teams spot promising leads earlier instead of relying only on an initial form submission.
Data Quality and Sales Processes
Data quality means lead information is accurate, complete, consistent across systems and up to date. Missing website activity or mismatched CRM records can distort the patterns a model learns. Review tracking and record consistency before relying on its rankings.
Sales processes matter just as much. A useful score needs a clear next step, such as routing high-priority leads to sales and recording each follow-up outcome. If teams leave scores untouched or fail to log won and lost opportunities, new data cannot reflect how the sales process works. Treat the model as guidance, not a substitute for sales judgement.
Scoring Data Sources
Predictive lead scoring can draw on CRM records, firmographics, campaign engagement, website behaviour, email activity and product-usage indicators. Each source adds context: company characteristics describe fit, while page visits and email interactions can reveal interest.
Models can analyse thousands of data points, including lead sources, sales activity and historical purchases. A step-by-step integration helps make those signals useful: connect the CRM and marketing automation platform, align shared lead fields and conversion outcomes, then return scores to the CRM. Sales and marketing teams can use the scores within their existing workflow.
How much does predictive lead scoring software cost? Pricing varies with data volume, integration needs and model capabilities. Request a quote to get pricing for a specific solution.
What are common predictive lead scoring mistakes and risks? Incomplete activity tracking, inconsistent CRM records and subjective assumptions can weaken predictions. Another risk is treating a score as a decision rather than a signal, especially when sales outcomes aren’t recorded for future model refinement.
To identify conversion patterns, compare the characteristics and activities of successful and unsuccessful leads. For example, examine whether certain lead sources, company profiles or sequences of website and email engagement appear more often among customers. The model uses these relationships to determine which signals matter, rather than assuming every interaction carries equal weight. Teams can then focus on patterns associated with conversion.
Model explainability
A predictive model is explainable when teams can see which factors shaped its score and influenced a lead’s ranking. A score alone sets a priority but doesn’t explain why. For example, a lead might rank highly because its company profile resembles previous customers, its engagement has increased, or both signals appear together.
That distinction makes a score easier to assess and act on. A salesperson can use the explanation to tailor a conversation, while marketing can see which campaign interactions correlate with stronger outcomes. Explanations should describe patterns the model detected, not claim that one action caused a purchase. Opening an email, for instance, may be associated with conversion without proving that the email prompted it.
Set up and validate the model
Start with a clear outcome: define what counts as conversion, then label historical records consistently. A model trained on mixed definitions, such as treating a sales-qualified lead and a closed customer as the same outcome, may produce rankings that don’t match the team’s goal.
Next, build the model using historical records and test it against new data that wasn’t used during training. Compare predictions with actual outcomes. Check whether high-ranked leads convert more often and whether promising leads are missed. Testing on new data helps assess accuracy and reliability instead of relying on how well the model fits familiar records.
Account for different lead groups
One model may not suit every audience. Leads from different industries, company sizes or acquisition channels can show distinct conversion patterns. If enterprise prospects typically need more sales engagement than smaller businesses, a single ranking may confuse buying readiness with a longer sales cycle.
Separate models can help when groups have enough reliable historical outcomes to reveal meaningful differences. Compare each model’s predictions with actual results for its audience, then check that score meanings remain clear to sales. Avoid splitting leads into narrow groups without a practical reason: too few records can make patterns unstable and weaken comparisons.
Refine explanations as patterns change
Model creation is ongoing. New customer interactions provide information that can help machine learning refine future predictions, while changes in campaigns or buyer behaviour can alter which signals matter. Review model performance every 3-6 months, and reassess inputs or algorithms if results decline. Track model versions, too, so teams can connect changes with improvements or setbacks.
Use explanations to ask focused questions: does a lead rank highly because of relevant engagement, or because a data field is incomplete or outdated? A predictive modelling approach can help turn complex patterns into clearer decisions, provided teams can connect scores to actual outcomes and understand the factors behind them.
Predictive prioritisation using conversion patterns
Conversion patterns help teams rank leads by signals associated with becoming customers. Scores can guide qualification, outreach and routing, helping sales and marketing focus effort where it matters.
Lead Qualification and Prioritisation
Predictive scoring supports qualification by comparing each lead’s characteristics and engagement with patterns from converted leads. The result helps teams prioritise prospects based on evidence of fit and interest, rather than treating every marketing-qualified lead as equally ready for sales.
For example, a score of 85 indicates a stronger conversion likelihood than a score of 60 in an illustrative scoring model. Sales can use that difference to decide which lead deserves earlier attention, while marketing can nurture leads whose engagement suggests interest but not immediate readiness. Scores guide these choices, they don’t replace a conversation with the prospect.
To make prioritisation useful, connect each score range to a defined action. A model may use 80-100 points for strong buying signals and sales outreach, 50-79 points for leads needing more nurturing, and 0-49 points for leads showing little engagement or lower current likelihood to convert. These are example ranges, not universal thresholds. Teams should align them with their own conversion patterns and qualification process.
Routing turns priorities into ownership. A high-scoring lead can go to the appropriate sales queue, while a mid-scoring lead remains in a marketing nurture stream. For instance, a team might route leads based on both score and company fit, helping a specialist handle prospects who match its target audience. Clear rules reduce uncertainty about who follows up and which leads need more engagement.
Prioritising High-Intent Leads
High-intent leads show combinations of engagement associated with stronger buying readiness. A model might find that leads visiting a pricing page twice in a week are 40% more likely to convert. That pattern can help a sales team prioritise timely outreach, especially when the lead also fits the intended customer profile.
Use the score as a signal, not a certainty. A pricing-page visit alone may reflect research rather than purchase intent, so consider it alongside other interactions and lead characteristics. Compare outcomes for high-scoring and lower-scoring groups, then refine routing and follow-up based on what converts. This gives sales and marketing a shared way to qualify leads and learn from each campaign.
Review patterns as customer behaviour shifts. If a campaign attracts leads who behave differently from earlier prospects, compare their scores with later outcomes before changing priorities. Track which score bands produce qualified opportunities, which routing paths lead to sales conversations, and where promising leads stall. These insights help teams focus effort, improve hand-offs and adjust qualification criteria without assuming every strong signal means an immediate sale.
Traditional versus predictive lead scoring
Both approaches rank leads, but they produce scores differently. Manual rules assign points to selected actions; predictive scoring learns from conversion patterns in historical data.
Traditional Point-Based Scoring
Traditional lead scoring assigns fixed points to prospect traits and actions chosen by marketers. For example, a model might award 5 points for opening an email, 10 for visiting a pricing page and 20 for a job title matching the target buyer.
Those points add up against a set threshold, such as 50 points for sales follow-up. This makes the rules visible and straightforward to adjust. However, the team must decide which behaviours matter and how much weight each one deserves. A lead’s score can therefore reflect the assumptions built into the system.
Predictive Scoring Compared with Traditional Methods
Predictive scoring uses machine learning to analyse lead data and identify patterns associated with successful conversions. Instead of assigning every pricing-page visit a fixed value, it can compare that behaviour with other signals and past outcomes.
This can reveal relationships that manual scoring rules overlook. Traditional lead scoring remains useful when teams need a simple, transparent framework or have limited historical data. Predictive models are better suited to finding patterns across larger datasets, but their results still depend on accurate records and relevant conversion outcomes.
Scoring and Forecasting Differences
Lead scoring ranks individual prospects by their likelihood to convert; sales forecasting estimates expected future sales across opportunities or a pipeline. A lead score can help determine who gets attention first, while a forecast helps managers assess potential revenue and sales progress.
For example, a high-scoring lead may still be early in the buying process. A forecast typically considers opportunity status and expected deal outcomes, not just a lead’s engagement. Use scoring to guide qualification and prioritisation, then forecasting to understand the broader sales outlook.
Challenges of Traditional Scoring
Manual scoring models can become inaccurate when buyer behaviour changes or teams assign points based on subjective assumptions. A rule that rewards email opens, for instance, may overvalue a light interaction compared with actions that historically precede a purchase.
Fixed rules can also miss combinations of actions. A single webinar attendance may mean little, while attendance followed by repeated product-page visits could signal stronger interest. Review how scores relate to actual conversions, and revise rules when the pattern no longer fits. This keeps a familiar system useful without treating its original assumptions as permanent.
Choose based on the decision you need to support. A small team with clear qualification criteria may benefit from manual rules that are easy to explain. When lead records contain enough reliable outcomes to reveal more complex patterns, predictive scoring can provide a richer basis for ranking. Some teams can use both: keep clear qualification rules, then use predictive insights to refine lead priorities.
Predictive lead scoring definition
Predictive lead scoring uses data and machine learning to estimate how likely a lead is to become a customer. A lead scoring model learns from past outcomes, then assigns each prospect a score reflecting patterns associated with conversion. For sales teams, the result is a ranked view of potential customers, not simply a list ordered by recent activity.
Imagine a platform analysing two leads. One has a strong demographic fit but little engagement; another fits the same customer profile and shows repeated interest in relevant content. A predictive model can weigh those signals together, based on how similar patterns appeared among previous customers. It can surface combinations of traits that a fixed rule may miss.
Scores often use a 0-100 point scale, though the number is a ranking aid rather than a universal measure. A score of 80 does not necessarily mean an 80% chance of conversion. Its meaning depends on how the model was trained, which outcomes it learned from and how the organisation uses the scale. Compare score bands with actual results to understand what high, middle and low scores mean for your sales process.
The model’s input can include demographic and firmographic details, lead source, campaign responses and sales activity. Its output can help teams decide which leads warrant attention, which need nurturing and which show fewer signs of fit or intent. The practical value comes from matching a score to a clear next action, rather than treating the number as an end in itself.
Lead scoring with predictive analytics also differs from a static qualification rule because the model can learn from new outcomes. If leads from a particular source repeatedly become customers, that pattern can inform future rankings. If the relationship changes, later results can reveal that too. Regularly comparing predictions with actual conversions helps teams see whether scores remain useful as buyer behaviour shifts.
Use the score as decision support. A sales representative can consider a lead’s ranking alongside conversation context, account fit and information the model may not capture. Marketing can use score patterns to understand which audiences and interactions tend to produce qualified opportunities. For example, if a campaign attracts high-scoring leads but few become customers, teams can investigate qualification and follow-up instead of assuming the score alone explains performance.
The takeaway is clear: a predictive lead scoring model turns past conversion patterns into a practical prioritisation signal. It helps sales teams decide where to focus, while validation against real outcomes keeps scores connected to business results.
Explore predictive analytics for lead prioritisation
Nodal AI: Nodal Platform
Nodal AI’s Nodal Platform helps businesses bring fragmented marketing data together and turn it into insights for assessing performance and guiding decisions. If your team wants to connect lead patterns with the wider customer journey, Performance Marketing Analytics and Predictive Modelling can help bring those signals into view. Growth Recommendations can support decisions based on the insights, while Automated Reporting makes performance information easier to review.
This is a natural next step when your organisation needs a clearer view of how marketing activity relates to lead quality and conversion patterns. Explore Nodal AI’s analytics platform to see how its capabilities can support your measurement needs.
Contact Nodal AI to discuss your analytics needs.
Turn lead priorities into shared progress
The next step is to make predictive scoring part of a shared decision-making process. Agree how sales and marketing will use each score, what feedback sales will provide, and how that feedback will inform future priorities. This turns lead scoring with predictive analytics from a ranking exercise into a practical way to learn which opportunities deserve attention and why.
Start with a clear business question. Do you want to prioritise leads that fit your target customer profile, understand which marketing activity contributes to qualified opportunities, or connect journey insights with sales outcomes? A defined question keeps analysis relevant and helps teams choose actions they can evaluate.
Nodal AI brings marketing performance insights together through the Nodal Platform. Its Performance Marketing Analytics, Growth Recommendations and Automated Reporting help teams make sense of their data and guide their next decisions. Ready to discuss how this could support your lead-scoring approach? Take the next step with Nodal AI.
Build clarity into the process to give your team a stronger foundation for moving promising leads forward.
Frequently Asked Questions
Can AI predict deal closure probability in CRM?
Yes, a model connected to CRM data can estimate the likelihood that an opportunity will close. The estimate is useful only when its outcome is clearly defined: closing a deal differs from converting a new lead into a customer. For example, a team can train predictions on past opportunity outcomes, then compare them with current pipeline records. Sales staff can use the estimate alongside deal context and customer conversations.
Isn’t predictive AI just a black box?
It doesn’t have to be. Choose models that show which factors contributed to a prediction, such as account fit, engagement or lead source. For example, a representative should be able to see whether a high ranking reflects repeated product interest or a close match to previous customers. Explanations let teams challenge misleading signals, discuss score quality and decide whether a prediction warrants follow-up.
What if I don’t have enough first-party data?
Begin with reliable information already available, such as CRM outcomes, lead sources and recorded campaign interactions. Keep the initial scoring approach focused, and record sales outcomes consistently as new opportunities progress. Third-party intent data can add context about potential buyer interest, but it shouldn’t hide gaps in internal records. As more outcomes accumulate, teams can assess whether a predictive model has enough relevant evidence for their use case.
What should I look for in lead scoring software?
Look for clear explanations of score drivers, connections to existing CRM and marketing systems, and outputs teams can act on in their normal workflow. Ask whether model performance can be tested against new outcomes and reviewed when customer behaviour changes. For a practical evaluation, map one score to one next action, such as sales follow-up or further marketing nurture, then assess whether the software supports that process.
Why are predictive analytics better than manual qualification to get high-value leads?
Predictive analysis can help teams compare signals consistently, revealing combinations that may be easy to overlook. This can surface leads that match valuable customer profiles, while manual qualification adds context a model may miss. For example, a model can flag an account’s fit and engagement, then a salesperson can assess its needs and timing before deciding how to proceed.
What is predictive lead scoring and how does it work?
It’s a way to rank prospects using patterns learned from lead and customer outcomes. A model analyses information about earlier opportunities, identifies characteristics associated with conversion, and applies those patterns to current prospects. For example, it may recognise that a particular combination of company profile and campaign response often appears among successful accounts. Teams can use the ranking to organise follow-up while considering each prospect’s circumstances.
What data and signals are used in predictive lead scoring?
Models can use lead source, company details, campaign responses, sales activity and interactions across marketing channels. The sequence of signals can matter: a demo request after a campaign response may indicate a different level of interest than an isolated email interaction. Connect records to a defined outcome, such as a qualified opportunity or closed sale, so the model can learn which signals relate to that result.
How do you build and implement a predictive lead scoring model?
First, agree on the outcome the model should predict and ensure historical records use that definition. Next, prepare representative lead and opportunity data, train the model, and test its predictions against records it hasn’t learned from. Then connect scores to the CRM and decide what action each score band triggers. Review results against actual sales outcomes, gather sales feedback and refine the model when patterns shift.


