

Growth can look healthy while a subscription business is quietly losing value. Marketing analytics for subscription businesses brings marketing and customer data together to show how acquisition costs, customer lifetime value, expansion revenue, cohort behaviour and churn shape performance. It helps teams identify which activity attracts subscribers who stay and grow, not just which campaigns generate sign-ups.
It’s easy to focus on new customer numbers: they’re visible, immediate and simple to report. But sign-ups alone don’t show whether acquisition is sustainable, existing customers are spending more, or a cohort is beginning to disengage. A clearer picture comes from connecting these signals instead of treating each metric as a separate result.
This article explains marketing analytics for subscription businesses and how to interpret the metrics that matter for growth. You’ll learn how acquisition cost compares with customer value, how average revenue per user and expansion reveal account growth, and how cohort analysis can surface churn patterns. Together, these measures help show what’s driving growth and where to focus next.
Key Takeaways
- Bring marketing and subscription data into a clearer view by addressing silos, data quality, privacy and tool overload.
- Compare customer lifetime value with acquisition cost to assess whether subscriber growth is sustainable.
- Track average revenue per user alongside expansion revenue to understand how existing subscribers contribute to growth.
- Use cohorts to spot changes in customer behaviour and identify patterns that may signal churn.
- Connect these measures to make more informed decisions about marketing investment and future growth.
What does marketing analytics mean?
Marketing analytics means collecting and analysing data from marketing activity to understand performance and guide decisions. For subscription businesses, it connects channel results with subscriber behaviour, revenue and retention. A campaign may attract plenty of sign-ups, for example, but cohort analysis can later show whether those subscribers remain active. This broader view makes marketing analytics useful beyond campaign reporting: it links customer actions to business outcomes.
The best tools bring relevant marketing and subscription data into one view, rather than adding platforms without a clear purpose. Choose based on the questions you need to answer, such as which channels attract subscribers who renew, and whether your data sources can connect. Prices vary by features, data volume, users and integrations, so compare the full cost against the functions your team will use.
Useful inputs include website page views, email opens, clickthroughs, social engagement, app activity and generated leads. Match those signals with subscription events, such as a trial starting, a plan changing or a cancellation. This can reveal patterns across the customer journey. For instance, if subscribers who use a particular onboarding page renew more often, that behaviour may point to a valuable experience worth improving.
Data silos make analysis harder. A marketing platform may record a lead, while a billing system records a renewal under a different identifier. Use a consistent customer identifier and event names, then reconcile records before comparing channels. Check for duplicate profiles, missing campaign tags and mismatched dates. A dashboard built on inconsistent records can make a strong channel look weak, or the reverse.
Privacy and data skills matter too. Collect only data that supports a defined purpose, limit access to appropriate roles, and handle customer information in line with applicable privacy rules, including GDPR where relevant. Customer support conversations, social interactions and website behaviour can provide useful first-party signals, but each requires responsible handling. Agree on metric definitions across marketing and analytics teams. For example, a shared definition of “active subscriber” prevents comparisons based on different measures.
Too many tools can create conflicting results. If several dashboards report different conversion figures, identify the source of truth for each metric and remove redundant reporting. Descriptive analysis explains what happened; predictive analysis uses past patterns to estimate what may happen next. Both are useful only when teams can interpret the findings and act on them. A drop in trial-to-paid conversion, for example, could prompt a review of the signup journey rather than an automatic increase in campaign spend.
To build a subscription marketing analytics dashboard, start with a decision, such as improving trial conversion or retention. Connect the relevant data sources, define each metric, segment results by channel or cohort, and display trends alongside the decisions they inform. Keep the view focused so teams can move from a signal to a practical next step.
Customer lifetime value and acquisition cost
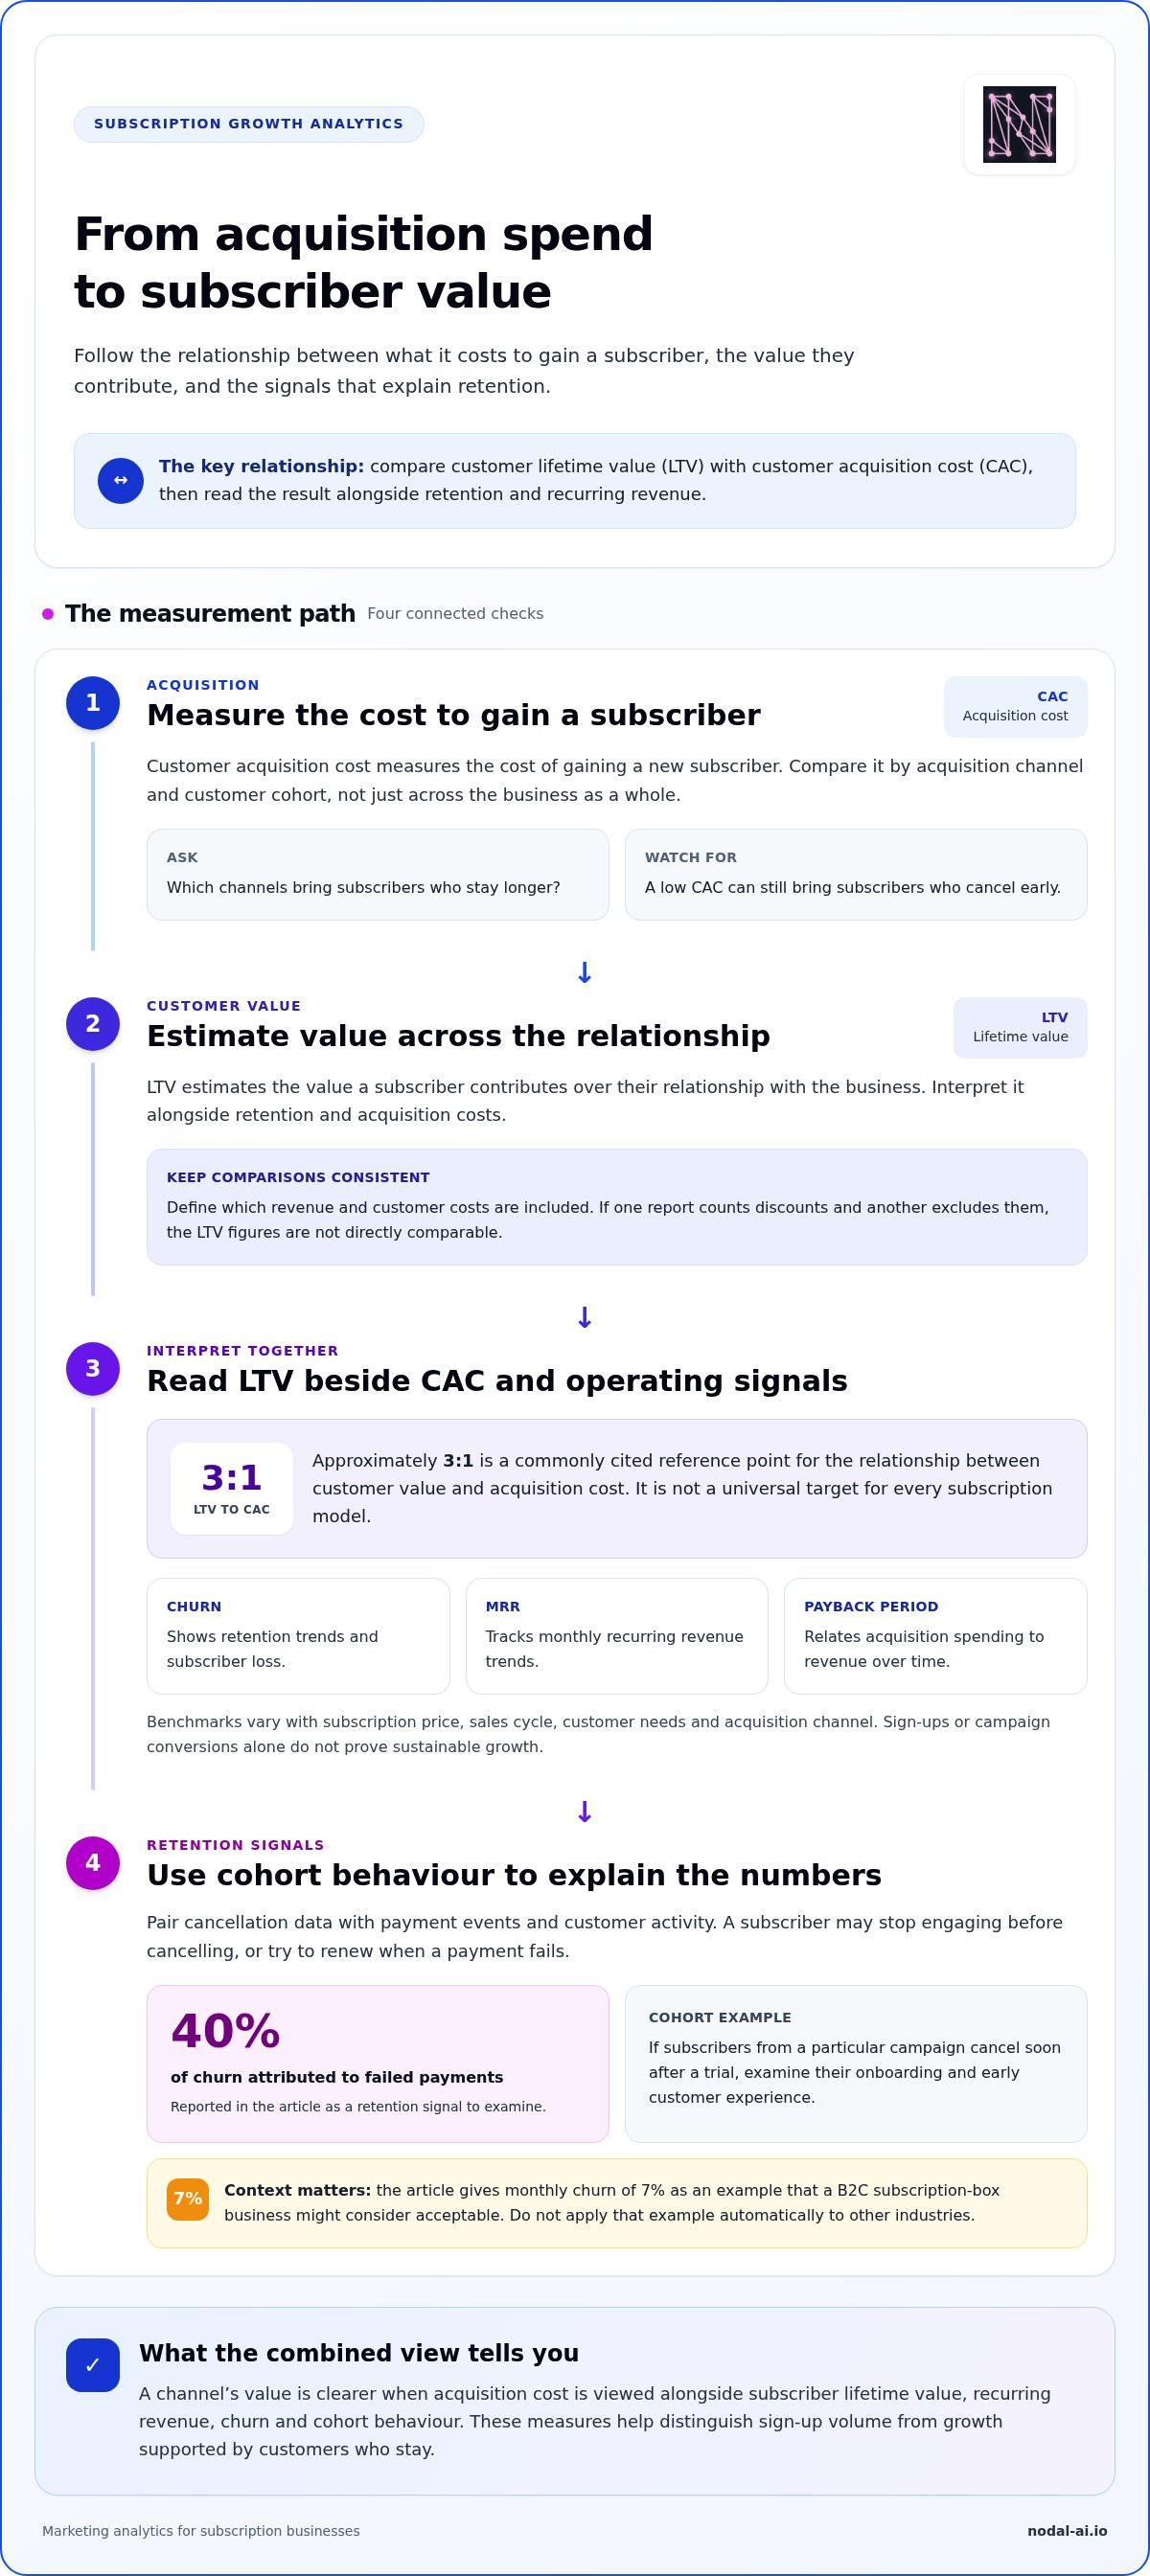
Subscription analytics connects acquisition spending with revenue earned over the customer relationship. Customer acquisition cost (CAC) measures the cost of gaining a new subscriber; customer lifetime value (LTV) estimates the value that subscriber contributes over time. Compare both by acquisition channel and customer cohort. A campaign with a low CAC may attract subscribers who cancel early, while a higher-cost channel may bring customers who stay longer.
Key metrics include CAC, LTV, churn, monthly recurring revenue (MRR) and payback period. CAC and LTV show the relationship between acquisition investment and customer value; churn and MRR reveal retention and recurring revenue trends. Payback period can help show how acquisition spending relates to revenue over time. Read these metrics together rather than treating sign-ups or campaign conversions as proof of sustainable growth.
One commonly cited reference point is an LTV-to-CAC ratio of approximately 3:1. It indicates a balance between customer value and acquisition cost, but isn’t a universal target for every subscription model. Industry benchmarks for conversion rates, CAC and LTV vary with factors such as subscription price, sales cycle, customer needs and acquisition channel. A B2C subscription box business might consider monthly churn of 7% acceptable; that example should not be applied automatically to other industries.
Estimate LTV from the revenue a subscriber generates over their relationship with the business, then interpret it alongside retention and acquisition costs. Define which revenue and customer costs your model includes before comparing channels. If one report counts discounts and another excludes them, for example, their LTV figures won’t be directly comparable. Consistent definitions make the metric more useful for budget decisions and campaign analysis.
Customer behaviour helps explain changes behind the numbers. A subscriber may stop engaging before cancelling, or attempt to renew when a payment fails. The research facts report that failed payments account for 40% of churn, making payment outcomes a useful retention signal to examine. Pair cancellation data with payment events and customer activity to distinguish a deliberate departure from a transaction problem. That distinction points to different actions.
Retention marketing works best when it responds to the data. If a cohort acquired through a particular campaign cancels soon after a trial, examine its onboarding and early customer experience. If renewals fail, focus on payment outcomes instead. Track retention and revenue changes for the original cohort. This shifts subscription marketing from a race for leads to a clearer view of which campaigns create lasting customer value.
Use models carefully. Forecasts based on historical churn can help estimate future customer value, but their usefulness depends on data quality and consistent metric definitions. Review assumptions when pricing, plans or acquisition channels change. A reliable CAC and LTV comparison gives teams a firmer basis for deciding where to invest, which campaigns to refine and which customer behaviours deserve closer attention.
ARPU and expansion revenue
Average revenue per user (ARPU) shows the revenue generated by each subscriber over a defined period. Calculate it by dividing revenue for that period by the average number of paying subscribers. Keep the period consistent: monthly revenue should be compared with average monthly subscribers. A plan upgrade can lift ARPU even if subscriber numbers stay steady, while discounts or downgrades can pull it down. Read ARPU alongside subscriber numbers to see whether revenue growth comes from more customers or greater value per customer.
Expansion revenue comes from existing subscribers increasing their spend, for example by upgrading plans, adding seats or purchasing an additional feature. Net revenue retention (NRR) captures expansion alongside revenue lost through downgrades and cancellations. In 2026, an NRR above 100% means the existing customer base grows in value without new acquisitions. Leading subscription companies achieve NRR rates of 120% or higher. These figures offer context, not a universal target: pricing structure, customer mix and expansion opportunities all shape what a business can achieve.
Consider the example of 1,000 customers paying $50 monthly. That subscription business generates $50,000 in monthly recurring revenue. If some customers upgrade, expansion can raise recurring revenue without adding subscribers. To understand the change, separate new-customer revenue from upgrades, added usage and price changes. This shows which strategies are moving the course of growth and whether a rise in ARPU reflects deeper customer value or a change affecting the whole subscriber base.
Revenue and cost modelling puts these movements in context. Compare subscription revenue with associated marketing spend, acquisition costs and discounts for the same period. Then segment results by channel, plan or customer group. One campaign may drive conversions to a lower-priced plan, while another attracts subscribers who later upgrade. Tracking only initial revenue would miss that difference. Consistent periods and segment definitions help teams compare performance and decide where further analysis can inform their next action.
Marketing return on investment (ROI) should reflect revenue over an appropriate customer relationship, not just the first payment. Attribute relevant campaign costs, then track subscriber revenue and expansion over time. A short reporting window can understate a campaign whose subscribers upgrade later; a long window can obscure a recent decline. Compare cohorts over the same intervals and state clearly which revenue components count. This gives a more useful measure of campaign contribution than clicks or sign-ups alone.
Use the metrics together. ARPU describes average revenue per subscriber; expansion revenue shows how existing accounts increase their contribution; NRR combines gains and losses across the customer base. If ARPU rises while NRR falls, upgrades may be concentrated among fewer subscribers, while cancellations or downgrades offset gains elsewhere. Break results down by customer segment and trace the relevant actions. This helps teams refine marketing strategies, improve conversion quality and focus on opportunities to grow revenue from existing customers.
Cohort analysis and predictive churn
A cohort groups subscribers who share a starting point, such as signup month, acquisition channel or plan. Track each group’s retention at the same stages of its subscription journey. For example, compare signup cohorts after equal periods rather than comparing a new group with long-standing subscribers. This reveals whether retention patterns are changing and which customer groups contribute lasting value.
Choose a consistent churn definition before comparing cohorts. Decide whether the measure counts cancellations, non-renewals or all subscribers lost during a period. Then compare the same period and subscriber type across groups. A monthly churn rate below 5% is typical of successful subscription businesses, though appropriate rates vary by industry. Treat that figure as context, not a universal threshold. A business with annual plans, for instance, needs to consider renewal timing when interpreting monthly changes.
Cohort dashboards make retention trends easier to investigate. A table can show signup month down the side and subscription age across the top, with retained subscribers at each point. Add filters for plan, channel and onboarding actions. If a cohort falls behind after its first renewal, examine the messages, product experience and support interactions it received. This gives teams a specific question to investigate instead of treating an overall churn figure as the full explanation.
Predictive churn models use historical customer behaviour to estimate which subscribers may cancel. Useful inputs can include changes in product use, missed renewals, support interactions and plan changes. The model produces a risk signal, not an explanation by itself. Reduced activity, for example, may reflect a seasonal pause, while a payment issue may need a different response. Consider the signals alongside customer context before choosing a retention action.
Businesses using predictive churn models report reducing cancellations by 15-25% compared with reactive retention approaches. The reported range is a benchmark, not a guaranteed result. Model quality depends on relevant historical data, clear cancellation definitions and regular review. Compare forecasts with actual cancellations over time. If the model flags subscribers who continue renewing, adjust its inputs or thresholds before using those predictions to prioritise retention efforts.
Look for meaningful behaviour patterns, not just predictions. Customers who use a particular feature may have 50% lower churn than other customers. That association can guide an investigation into onboarding or product engagement, but it doesn’t prove the feature caused stronger retention. Compare similar customer groups and examine when feature use begins. Then test whether encouraging that behaviour changes outcomes for later cohorts.
Connect each insight to an action and a follow-up measure. If a cohort loses engagement after onboarding, test a relevant intervention and track retention against a comparable group. If a forecast identifies payment or activity risks, record the response and whether the subscriber stayed. This disciplined cycle helps teams improve retention decisions and strengthen the evidence behind future forecasts.
Marketing analytics and business growth
Growth is easier to steer when tracking connects marketing activity with recurring revenue and customer engagement. A rise in website visits alone doesn’t show whether the business is gaining lasting value. Compare channel performance with subscriber conversion, retention and expansion trends. If a campaign brings more trials but fewer renewals, for example, its initial reach may hide a weaker contribution to lifetime revenue. The useful question is not just what increased, but which customer behaviour changed alongside it.
Analytics supports growth decisions by showing where momentum comes from. Separate new-customer revenue from expansion and reactivation, then compare those movements over the same period. This reveals whether growth depends mainly on new acquisition or on existing subscribers deepening their engagement. Examine the customer journey too: a change at one touchpoint may influence conversion later. Linking campaign exposure to subscriber actions helps teams make decisions based on connected patterns rather than isolated channel reports.
Forecasting adds a forward view. Companies using advanced subscription analytics report 31% better revenue predictability than companies relying on basic metrics. Treat this as a reported comparison, not a promise for every business. A forecast is more useful when it states its assumptions, reflects changing subscriber behaviour and can be compared with actual results. If predicted growth repeatedly differs from observed revenue, review the inputs, such as renewal patterns, plan changes or channel mix.
Growth benchmarks can help frame a discussion, but they need context. Monthly MRR growth of +5-15% and annual ARR growth of +15-30% are presented as healthy ranges. Compare like with like: a young subscription service and a mature business may have different acquisition opportunities and retention patterns. Track the movement over time, and connect it to the underlying drivers. A growth rate without its customer and revenue context cannot show whether progress is sustainable.
Use analytics to turn observations into decisions. If a campaign drives engagement but not paid conversion, examine the next stage of the journey before increasing investment. If one channel brings subscribers with stronger lifetime value, compare its costs and retention with those of other channels. Set a measurable follow-up, such as reviewing conversion or recurring revenue after a campaign change. This creates a clear cycle: observe trends, choose an action and assess the outcome against the original measure.
Cross-channel reporting can also improve planning. A reported 98% of marketers understand the importance of a complete, centralised view of cross-channel marketing. The practical value is consistency: teams can compare campaign activity, subscriber responses and revenue using shared definitions. When dashboards disagree, identify which source governs each measure. This reduces conflicting interpretations and helps leaders allocate attention to the actions most closely connected with growth.
Use connected performance insights to guide your next growth decision.
Explore marketing analytics features
Nodal AI: Nodal Platform
Nodal AI’s Nodal Platform helps subscription teams bring fragmented marketing data into a clearer view. Performance Marketing Analytics connects campaign performance with customer journey insights, while Growth Recommendations help identify potential actions. Automated Reporting makes it easier to review results without relying solely on manually assembled reports. The platform is a natural fit when acquisition, retention and revenue metrics sit across separate sources, or when teams need to turn performance patterns into more informed decisions.
Explore Nodal AI’s analytics platform to see how it could support your subscription growth work, or visit nodal-ai.io.
Make your next growth decision with clarity
Turn analysis into a repeatable decision-making habit. Choose a business question, agree on the evidence that can answer it, then use what you learn to guide the next action. Over time, marketing analytics for subscription businesses can help focus attention, test assumptions and support clearer growth decisions.
When disconnected data or conflicting reports make analysis difficult, Nodal AI’s Nodal Platform, Performance Marketing Analytics and Growth Recommendations help teams interpret performance and identify opportunities. The next step might be refining how you measure a customer journey, reviewing campaign performance or making insights easier to act on.
Start with the business question that matters most. A clearer view can help your team move forward with purpose.
Frequently Asked Questions
How do you turn data into actionable insights?
Start with a decision the team needs to make, then identify the data that can inform it. If trial users stop before activating an account, for example, compare their signup source, onboarding steps and product activity. Check whether the pattern appears across customer groups before changing a campaign. Assign an owner to the next action and define a measure of success, so analysis leads to a decision rather than another report.
What is subscription marketing?
Subscription marketing attracts, converts and retains customers who pay for ongoing access to a product or service. It includes communications across the customer journey, from explaining a trial offer to encouraging renewal or plan changes. A meal-kit company, for example, might use educational emails to help new subscribers choose recipes, then share relevant plan options as their preferences change. The aim is to build an ongoing customer relationship, not just make a one-time sale.
How do you calculate customer acquisition cost and lifetime value for a subscription business?
Calculate customer acquisition cost by dividing acquisition spending for a defined period by the number of new customers gained during that period. Include the campaign and sales costs your business has chosen to count, and apply the same definition each time. Estimate lifetime value using customer revenue over the relationship, with your chosen margin and retention assumptions. Comparing these measures by channel can show how customer quality differs.
How can subscription businesses track attribution across free trials, upgrades, renewals and cancellations?
Track each milestone as a dated event tied to a consistent subscriber identifier. Record trial starts, paid conversions, plan upgrades, renewals and cancellations alongside campaign and channel data. Then compare attribution approaches, such as first interaction, last interaction or credit shared across several touchpoints. A campaign may prompt a trial while later messages support an upgrade. Keep event definitions consistent so teams can interpret the journey without confusing a trial with paid revenue.
How can cohort analysis identify retention and churn trends?
Group subscribers by a shared starting point, such as signup month or campaign, and compare their activity at equivalent stages. Look for changes in each group’s engagement or renewal behaviour. If subscribers from one campaign stop using a key feature before renewal, for example, investigate their onboarding experience and expectations. Comparing like-for-like cohorts helps distinguish a campaign-specific pattern from a seasonal change or a shift affecting all subscribers.
How do subscription businesses measure the impact of campaigns on recurring revenue?
Compare recurring revenue for subscribers exposed to a campaign with a suitable comparison group, using the same observation period. Track paid conversions, renewals, upgrades, downgrades and cancellations, not just clicks or trial starts. A retention campaign could increase renewals but also prompt plan downgrades. Reviewing both outcomes clarifies its net revenue contribution. Document campaign dates and attribution rules so later reporting can distinguish campaign influence from other changes.
What data privacy rules affect subscription marketing analytics in the United States?
US privacy requirements can depend on the state, the information collected and how a business uses or shares it. Subscription marketers should map data flows, explain collection practices clearly, honour applicable consumer choices and limit access to customer records. Analytics that connect email activity with billing data, for example, need controls around purpose and access. Review privacy processes as tools and data uses change, and avoid collecting information without a defined business need.
What are common pitfalls and risks in subscription marketing analytics?
Common risks include inconsistent metric definitions, duplicate customer records, incomplete campaign tagging and attributing every renewal to the last interaction. Each can distort channel comparisons or obscure why subscribers leave. A billing record may show a renewal while a marketing report counts the same person as a new conversion. Document event rules, reconcile key records and review unusual changes before acting. Restrict data access as well to reduce unnecessary exposure of customer information.


