
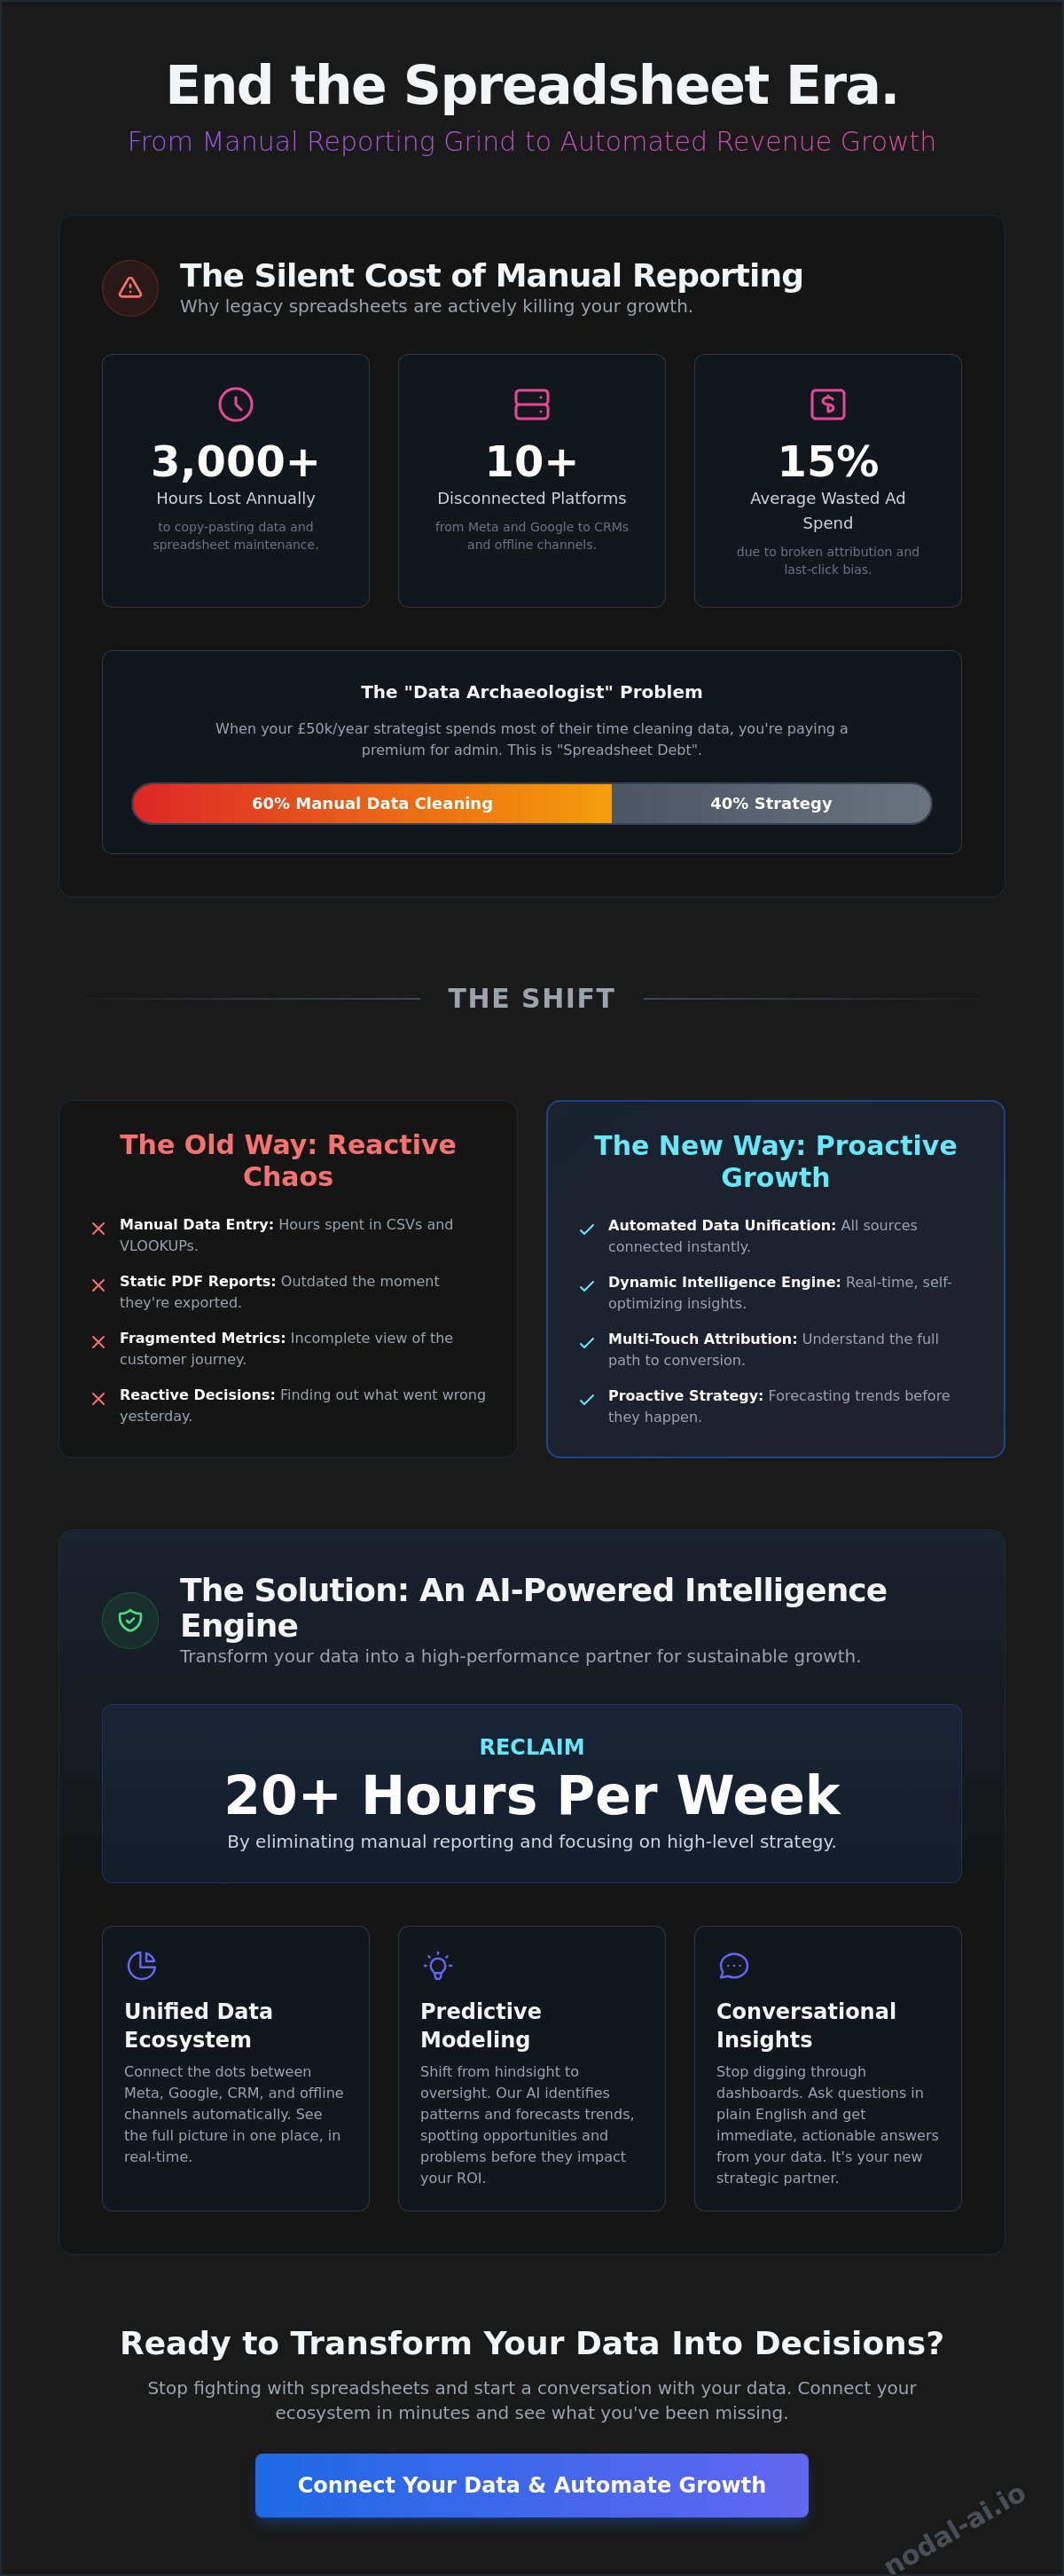
The average marketing department loses over 3,000 hours every year to the manual grind of copy-pasting data across 10 or more different platforms. It's a staggering waste of talent that keeps high-level strategists trapped in a cycle of data entry and spreadsheet maintenance. You likely recognize the frustration of looking at a report and doubting its accuracy because of last-click attribution bias or fragmented metrics. It's time to reclaim your schedule and stop digging through cells to find the truth. By implementing automated reporting, you can finally connect the dots between your marketing spend and actual revenue growth.
This article shows you exactly how to transition from data-heavy chaos to clear, profitable decisions. You'll discover how an AI-powered business intelligence engine can replace manual labor with automated growth recommendations; this gives you the freedom to focus on high-level strategy instead of formatting. We'll explore the simple steps to unify your performance metrics, eliminate attribution errors, and start making smarter decisions that drive sustainable ROI. It's time to talk to your data and let the spreadsheet era end today.
Key Takeaways
- Reclaim thousands of hours by eliminating "spreadsheet debt" and the psychological toll of fragmented marketing data.
- Shift from static PDF exports to a self-optimising intelligence engine that allows you to talk to your data.
- Build a smarter framework for automated reporting that aligns fragmented metrics with profitable business outcomes.
- Connect the dots between Meta, Google, and offline channels to save 20+ hours of manual labor every week.
- Transform your data ecosystem into a high-performance intelligence engine built for sustainable growth.
The Silent Cost of Manual Reporting: Why Spreadsheets are Killing Your Growth
Growth doesn't happen in a cell. It happens when you stop digging and start deciding. Most UK marketing teams currently struggle under "spreadsheet debt," a state where the time spent maintaining legacy trackers exceeds the time spent generating revenue. This debt isn't just a technical burden; it's a strategic anchor that keeps your best minds stuck in the past. When your team spends Monday to Wednesday stitching together CSV exports, they aren't looking at the future. They're performing data archaeology.
The shift toward What is Automated Reporting in the Age of AI? marks the definitive end of this manual era. By replacing static rows with live narratives, automated reporting allows you to talk to your data instead of fighting it. Relying on manual updates forces teams into a reactive loop. You find out a campaign failed three days after the budget is gone. This lag creates a culture of "Last-Click Bias," where marketers overvalue the final touchpoint simply because it's the easiest to track in a standard Excel sheet. The result is skewed ROI and a complete misunderstanding of what actually drives your customer to convert.
The Fragmentation Crisis: Navigating the 2026 Data Ecosystem
The typical UK marketing stack now spans 10+ distinct silos, from Meta Ads and TikTok to CRM systems and email platforms. Connecting these dots manually is no longer just difficult; it's impossible. Broken attribution data leads to an average of 15% wasted ad spend because teams can't see the full customer journey in real-time. You can't map a complex, multi-touch journey across 2026's fragmented ecosystem using a VLOOKUP. You need a unified engine that turns fragmented data into profitable decisions instantly.
The 3,000-Hour Drain: A Financial Audit of Manual Labour
The math of manual reporting is devastating. When an analyst earns £50,000 a year but spends 60% of their time cleaning data, you're paying a premium for basic admin. Across a standard team, this scales to a 3,000-hour annual drain. This is the ultimate opportunity cost; while your team builds pivot tables, your competitors are using real-time insights to pivot their strategy. Reporting Fatigue acts as a psychological barrier to innovation, draining the creative energy required to scale a brand. Connect your sources, automate the flow, and turn your data into a Smarter partner for growth.
What is Automated Reporting in the Age of AI?
Automated reporting has evolved from a simple scheduled task into a self-optimizing intelligence engine. It's no longer about exporting a static PDF that's outdated the moment it hits your inbox. Today, it's a dynamic system that identifies patterns while you sleep. A KPMG report on financial automation indicates that 70% of financial processes are ripe for this shift, moving away from manual entry toward integrated, real-time systems. While traditional ETL (Extract, Transform, Load) processes require data engineers to build rigid pipelines, AI-powered business intelligence connects fragmented data sources instantly. This shift allows for predictive modeling that forecasts future revenue instead of just tallying last month's losses. You move from reactive panic to proactive strategy.
- From Static to Dynamic: Reports now update in real-time as data flows in from your ecosystem.
- From Manual to Autonomous: AI handles the "cleaning" of data, removing the need for manual spreadsheet scrubbing.
- From Hindsight to Oversight: Predictive tools use historical data to spot trends before they become problems.
Multi-Touch Attribution: The Brain Behind the Report
Simple automation is useless if it credits the wrong channel. You need to see the whole journey to make automated reporting effective. Nodal AI identifies "hidden" touchpoints across the entire customer lifecycle, connecting the dots between a first-touch LinkedIn ad and a final-touch direct search. Without sophisticated attribution, your reporting is just a guess. With it, you turn complex data into profitable decisions. You can connect your data ecosystem to see exactly where your budget works hardest and scale with confidence.
Talk to Your Data: The New Interface of Insight
Dashboards are changing; they're becoming conversational partners. You don't need a data science degree to understand performance trends anymore. You just ask. Natural language queries allow you to type "Why did CAC spike in March?" and get a clear, visual answer instantly. This eliminates the 3,000 hours a year many teams waste on manual analysis and pivot tables. Smarter platforms make clarity the default, not the exception. It's a cognitive upgrade for your business that replaces the anxiety of fragmented data with the relief of actionable insights.
Case Study: Reclaiming 20+ Hours Weekly Through Automated Intelligence
A London-based retail enterprise recently found itself trapped in a 40-hour weekly reporting cycle. Their marketing team spent four full workdays every week manually exporting CSV files from Meta, Google Ads, and offline warehouse systems. It was a process defined by exhaustion rather than insight. They were looking at the past through a rearview mirror, often making decisions on data that was already seven days old. This manual burden prevented the team from actually optimizing their campaigns, as they were too busy just trying to document them.
Phase 1: Unifying the Fragmented Data Ecosystem
The first step toward efficiency required breaking down the "Walled Garden" problem. Digital attribution is often skewed because platforms like Meta and Google don't share data naturally. The Nodal Platform integrated these fragmented streams into a unified metrics dashboard. This process didn't just look at current spend; it ingested three years of historical data to provide context. By establishing a single source of truth, the brand eliminated the discrepancies that usually lead to boardroom arguments. They moved from fragmented data to absolute clarity on day one. They finally had the tools to connect the dots across the entire customer journey without manual intervention.
Phase 2: From Hindsight to Growth Recommendations
The shift to automated reporting changed the team's fundamental question. They stopped asking "What happened last month?" and started asking "What should we do tomorrow?" Nodal's AI engine identified that 12% of their ad spend was being wasted on overlapping audience segments in the London metro area. These were insights that manual spreadsheets simply couldn't catch in real time. The platform turned passive data into an active growth partner.
- Immediate Optimization: The platform flagged underperforming creative assets within 48 hours of launch, preventing wasted spend.
- Revenue Growth: Reallocating budget based on automated growth recommendations led to a 15% increase in ROAS within the first 90 days.
- Time Recovery: The team reclaimed 22 hours per week, allowing them to focus on creative strategy instead of cell formatting.
The transition transformed the internal culture. The CMO experienced the relief of clarity, knowing that every pound spent was backed by a real-time intelligence engine rather than a prone-to-error spreadsheet. They no longer had to dig through rows of cells to find a win. Instead, they could talk to their data and receive actionable answers instantly. It was the end of the spreadsheet era and the beginning of sustainable, smarter growth for the entire organization.
Building Your Smarter Reporting Framework: A 5-Step Guide
Stop losing 15 hours every week to manual data entry. Transition from fragmented spreadsheets to a unified intelligence engine. Building a robust framework for automated reporting isn't just about platforms; it's about strategy. You need a system that translates raw numbers into profitable decisions without the friction of manual analysis. Experts like Cloud2b can assist in this transition by optimizing your productivity stack and workflows. It's time to move from data hoarding to data clarity.
Step 1: Connecting the Dots Across Channels
Mapping the customer journey is your first priority. You can't automate what you don't understand. Start by identifying every touchpoint, from the first ad click to the final conversion. A 2023 Forrester report found that up to 73% of data within an enterprise goes unused for analytics. Don't let your data sit idle. Ensure your data governance is ironclad and GDPR compliant before you sync your sources. Focus on revenue-driving metrics like Customer Acquisition Cost (CAC) and Lifetime Value (LTV) instead of vanity metrics like page views or social likes. Connect the dots to see the full picture of your brand health.
Once your journey is mapped, define unified metrics that align with your bottom line. Select an AI-powered platform that prioritizes multi-touch attribution. This allows you to see exactly which channel deserves credit for a sale. Without this, your marketing budget is a guessing game. You're moving from blind spending to precision investing. This transition ensures every dollar spent is tied to a specific business outcome.
Step 4: Empowering Teams with Actionable Intelligence
Information is only valuable if it's timely. Monthly reviews are often 30 days too late to save a failing campaign. Switch to real-time optimization by setting up automated alerts for significant performance shifts. If your conversion rate drops by 12% on a Tuesday, you should know by Tuesday afternoon, not the following month. Customize dashboards for different stakeholders. Your CFO needs to see ROI and cash flow; your marketing manager needs to see click-through rates and cost-per-lead. When you talk to your data, you get the answers you need instantly.
The final step is iteration. Use predictive models to forecast future trends based on historical patterns. Your automated reporting system should offer growth recommendations, telling you where to scale and where to cut back. This creates a cycle of continuous improvement that saves your team over 3,000 hours a year in manual labor. It's a cognitive upgrade for your entire business.
Ready to see your business clearly? Connect your data sources today and start making smarter decisions.
The Nodal Advantage: Transform Your Data into Profitable Decisions
UK marketing leaders face a unique challenge: managing a fragmented data ecosystem that spans dozens of platforms. Nodal AI acts as your smarter partner, replacing manual labor with an AI-powered business intelligence engine. We help you move from data to clarity. By implementing automated reporting, you eliminate the risk of human error and the soul-crushing weight of manual entry. It's about more than just efficiency; it's about gaining the cognitive upgrade your business needs to compete in a crowded market.
Our platform provides enterprise-level security to protect your most sensitive assets. We use high-level encryption to ensure your data remains yours, even as it flows through our sophisticated engine. This isn't just about collecting numbers; it's about making them talk. Nodal AI turns your metrics into a conversational partner, allowing you to ask questions and receive answers that drive revenue. We replace the anxiety of digging into spreadsheets with the calm efficiency of actionable insights.
Smarter Decisions, Sustainable Growth
Most platforms take months to configure. Nodal AI focuses on "day one" value. You'll see profitable insights the moment you connect your accounts. Our predictive customer journey mapping gives you a competitive advantage by identifying retention opportunities before they disappear. We don't just provide a tool; we provide a vision for the future of your analytics. One of our partners recently saved 3,000 hours a year by switching to automated reporting. That is time they now spend on creative strategy and sustainable growth rather than wrestling with broken formulas.
Connect Your Data Today
The era of the spreadsheet is over. You don't need a PhD in data science to understand your business performance. You simply need a tool that connects the dots for you. You can start your journey toward clarity in three simple steps:
- Connect: Plug in your fragmented data sources through our secure, seamless integrations.
- Unify: Let the AI engine create a single source of truth for all your marketing metrics.
- Grow: Talk to your data to uncover profitable insights and make smarter decisions instantly.
Waiting only increases the gap between you and your competitors. It's time to leave the manual grind behind and embrace a future of clear, confident decision-making. Book a demo to see how Nodal AI connects the dots for your business.
Connect the Dots for Sustainable Growth
The era of manual data entry is over. Relying on static spreadsheets isn't just slow; it's a direct cost to your bottom line. By adopting automated reporting, you move from fragmented data to absolute clarity. You've seen how teams reclaim 20 hours every week by letting AI handle the heavy lifting. This shift allows your brightest minds to focus on high-level strategy rather than searching for broken formulas. Nodal AI secures this transition with enterprise-level encryption and GDPR compliance, ensuring your information remains protected while you scale.
Real-time updates and AI-driven growth recommendations provide the competitive edge needed in today's market. When you save over 3,000 hours per year, you aren't just saving time; you're gaining the freedom to innovate. It's time to stop digging through tabs and start making smarter moves. Your data has a story to tell. Listen to it and turn every metric into a revenue-driving asset.
Transform your fragmented data into profitable decisions; talk to your data with Nodal AI
The future of business intelligence is here, and it's ready to work for you.
Frequently Asked Questions
How does automated reporting improve marketing ROI?
Automated reporting boosts ROI by eliminating manual data entry errors and saving teams an average of 3,000 hours per year. This transition allows your staff to shift from tedious spreadsheet management to high-impact strategic execution. By viewing real-time performance data, you can reallocate budget from underperforming ads to high-yield channels instantly. This level of agility often leads to a 22% increase in conversion rates for data-driven brands.
Can automated reporting tools handle multi-touch attribution?
Yes, these platforms use an AI-powered business intelligence engine to track every customer touchpoint across a fragmented ecosystem. They move beyond basic last-click models by applying weighted credit to every interaction in the buyer journey. This precision helps you grow smarter by identifying exactly which social ads or emails drive the final sale. You get a clear view of the 20% of channels that typically generate 80% of your revenue.
Is automated reporting secure for sensitive enterprise data?
Top-tier platforms protect your information using enterprise-level encryption and SOC 2 Type II compliance standards. Data remains secure both in transit and at rest through 256-bit AES protocols. You maintain total control over user permissions, ensuring only authorized team members can talk to your data. This rigorous security framework eliminates the risks associated with emailing unencrypted spreadsheets or using unprotected cloud drives.
How long does it take to implement an automated reporting platform?
Most organizations complete the implementation process within 24 to 48 hours using standard API connections. Users often see their first unified metrics on day one because the 3-step setup removes traditional technical hurdles. You can connect your accounts and transform complex data into clarity almost immediately. There's no need for lengthy IT projects or custom coding to start seeing results.
What is the difference between automated reporting and a dashboard?
Dashboards show you what happened, but automated reporting explains why it happened and suggests your next move. While dashboards are often static visualizations, an automated reporting system connects the dots between disparate sources to provide proactive alerts. It turns a passive display into an active partner. This technology moves your team away from staring at screens and toward making profitable decisions based on AI-generated narratives.
Will automated reporting replace my data analyst team?
No, it empowers your analysts to act as strategic partners instead of data cleaners. Industry reports from 2023 show that analysts spend 80% of their time on manual data preparation. Automated reporting handles the repetitive extraction tasks, freeing your experts to focus on deep-dive interpretation. Your team stays essential, but their daily work shifts from digging in spreadsheets to driving sustainable growth through high-level insights.
How does AI help in identifying marketing trends automatically?
AI uses machine learning algorithms to detect anomalies and pattern shifts that are invisible to the human eye. It scans millions of data points across your unified metrics to flag emerging consumer behaviors as they happen. If a specific audience segment increases its engagement by 15%, the system alerts you before the trend peaks. You don't have to search for opportunities; the AI brings them to your attention.
What integrations are required for automated marketing reports?
You should connect your advertising platforms, CRM, and web analytics to create a single source of truth. Most brands begin by integrating Google Ads, Meta, and Shopify to bridge the gap between marketing spend and actual revenue. Advanced systems support over 150 seamless integrations to unify your entire data ecosystem. This connectivity allows you to talk to your data across every channel without any manual exports.