

A bigger marketing stack won’t automatically lead to better decisions. A useful growth marketing analytics stack connects your CRM, automation, analytics and reporting tools through shared data and clear measurement, so teams can see what’s working and act without reconciling conflicting dashboards.
It’s easy to assume the answer is another platform. Often, the real challenge is getting existing tools to work together: data must flow between systems, key measures need consistent definitions, and every important data point needs a reliable source of truth.
This guide shows you how to choose tools around your goals, connect them into a practical feedback loop and build a stack that can scale with your business. You’ll learn how to audit data quality, reporting effort and decision speed, then identify where analytics, attribution, customer journey mapping or automation can bring clarity. The aim is to turn scattered signals into confident next steps, not add complexity.
Key Takeaways
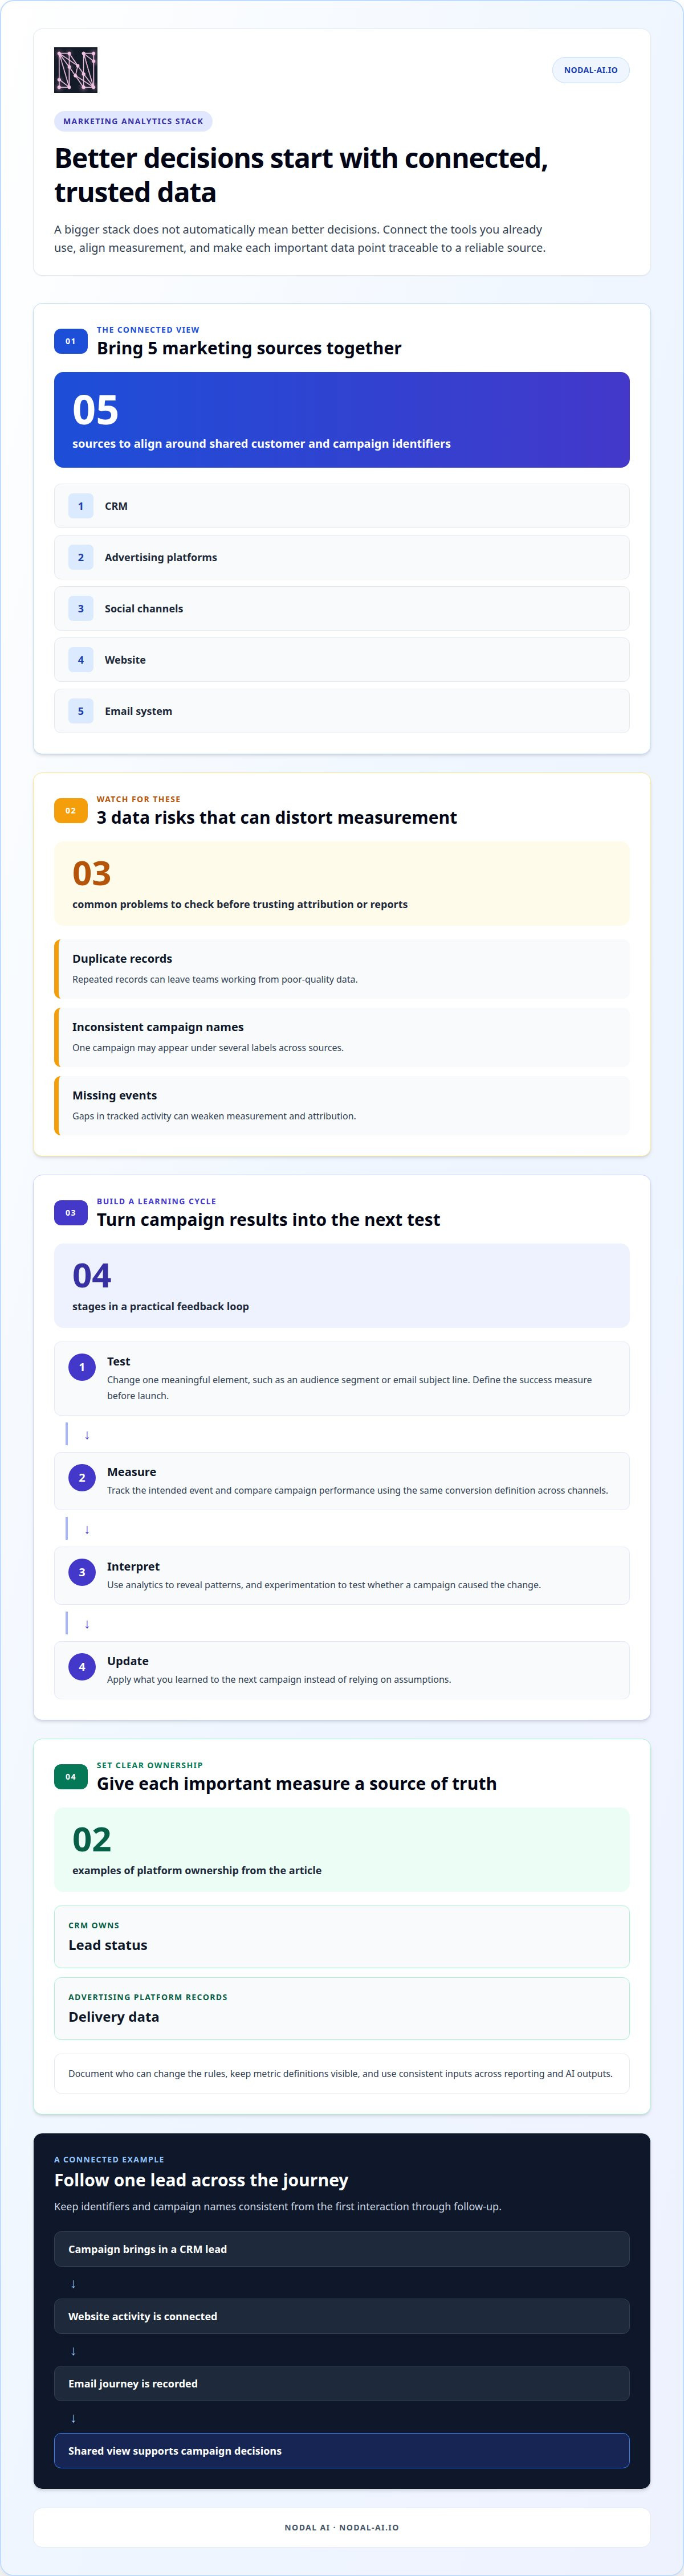
- Unify CRM, advertising, social, web and email data so teams can make decisions from a broader view of performance.
- Choose a reliable source of truth for each key data point and build infrastructure that makes first-party data useful across your tools.
- Connect campaign measurement, predictive analytics and lifecycle automation to improve how you test and optimise marketing activity.
- Match reporting and personalisation tools to business goals, then assess how well your existing platforms integrate.
- Audit workflows, attribution and decision speed to identify friction, simplify your ecosystem and focus on the insights that support action.
What is the modern marketing stack today?
A modern marketing stack connects platforms so CRM, advertising, social, web and email data can inform decisions together. Common risks include duplicate records, inconsistent campaign names and missing events. These can distort attribution and leave teams acting on poor-quality data.
-
Unify Marketing Data Sources
Connect your CRM, advertising, social, web and email platforms using shared customer and campaign identifiers. For example, align a CRM lead with the campaign that brought them in, the website activity that followed and the email journey they received. Check that dates, channel names and conversion events mean the same thing across sources. Otherwise, one campaign may appear under several labels.
-
Centralise Governed First-Party Data
Choose infrastructure that brings first-party data into a usable, governed view, such as a data warehouse or customer data platform. Assign a source of truth to each important measure: the CRM might own lead status, while the advertising platform records delivery data. Define who can change these rules, and document them so reporting and AI outputs use consistent inputs.
- Map each source before deciding how data should move. List what the CRM, ad platforms, social channels, website and email system contribute, then identify duplicate fields and missing customer identifiers. A campaign record, for instance, should keep a consistent campaign name from an advert click through to a CRM conversion. This map helps you evaluate marketing technology against actual data needs, not overlapping features.
- Build a central view that supports decisions, not just storage. A data warehouse can bring campaign, website and CRM records together for analysis, while connected platforms can send useful insights back into marketing workflows. If a report shows that an email campaign generated qualified leads, teams can use that finding to refine audience segments or follow-up journeys. Keep definitions visible beside each metric.
- Govern data flows before adding AI to the architecture. Set clear permissions, consistent event definitions and a process for correcting inaccurate or duplicated records. Then assess whether the data suits uses such as audience analysis or predictive scoring. AI can support sound decisions only when its inputs reflect reliable customer activity, rather than gaps between disconnected sources.
How to Build a Scalable Marketing Analytics Stack for Growth?
In the United States, stack costs depend on tool choices, data volume, integration work and ongoing platform use. Set your strategy first, then assess which marketing technology earns its place by improving measurement or action.
-
Measure Marketing Campaigns
Define the outcome before selecting tracking tools. For a lead-generation campaign, connect ad clicks with form submissions, qualified leads and eventual sales. Compare campaign performance using the same conversion definition across channels, and make sure reporting distinguishes attributed results from incremental impact. Analytics can reveal patterns, while experimentation helps test whether a campaign caused the change.
-
Apply AI to Optimise Campaigns
Use predictive scoring to rank prospects by their likelihood of taking a useful next step. Feed the model consistent marketing data, such as past conversions, engagement and lifecycle stage, then compare scores with actual outcomes. AI can suggest campaign adjustments or audience priorities, but keep human review in the loop. Models support optimisation; they don’t replace brand judgement or strategy.
- Run controlled experiments to improve decisions. Change one meaningful element, such as an audience segment or email subject line, and define the success measure before launch. Use predictive analytics to estimate which groups may respond, then compare those forecasts with observed campaign results. This creates a learning cycle: test, measure, interpret and update the next campaign instead of relying on assumptions.
- Connect marketing automation to lifecycle stages. For example, a new subscriber can receive a welcome sequence, while a CRM status change can trigger relevant follow-up. Set behavioural conditions around clear events, such as a product-page visit or completed purchase. Reverse ETL can send selected warehouse insights into operational platforms, making updated segments available to campaign workflows.
- Review the complete campaign loop before expanding it. Confirm that tracking captures the intended event, the analytics layer measures it consistently, and automation uses the resulting insight appropriately. Then identify the challenge that matters most, such as weak lead quality or slow follow-up, and prioritise one improvement. Teams exploring integrated analytics capabilities can see how connected insights support this process.
Business intelligence and reporting tools
Choose reporting tools that turn marketing activity into measures your team can use. Start with business goals, then assess how existing martech platforms integrate and support adoption.
-
Assess Existing Tools
Inventory each reporting, analytics and visualisation tool already in use. Record its users, data inputs, key metrics and the decisions it supports. Then identify duplicate dashboards, manual exports and conflicting revenue figures. A tool that cannot connect to relevant sources may create extra work, even if its reports look polished. Preserve useful capabilities before adding another platform.
-
Choose Tools for Business Goals
Match each tool to a clear business goal before comparing features. A brand-awareness programme may need reach and engagement reporting, while an ecommerce team may prioritise transactions, revenue and repeat purchases. For B2B lead generation, connect campaign activity with lead quality and sales outcomes. This keeps adoption focused on useful measures, rather than the broadest feature list.
- Define shared metrics for business intelligence. Give each measure a consistent name, calculation and owner, then use those definitions across dashboards. For example, teams may report different qualified-lead totals if they apply different status rules. Document the calculation beside each metric so users can interpret results consistently and understand which business decisions it informs.
- Integrate tools through available connectors, open APIs or standardised data formats. Map fields before transferring records, especially customer identifiers, campaign names and transaction values. Test a small data flow first: an ecommerce order should retain its source campaign and revenue value in the reporting view. Resolve mismatches at the integration point, rather than adding manual corrections to each dashboard.
- Evaluate personalisation tools by the actions they enable. A commerce platform might use browsing or purchase signals to tailor product recommendations, while an email system can adapt content to a customer segment. Connect each experience to an outcome measure, such as completed purchases or repeat engagement. Avoid features that rely on disconnected data or cannot show how audiences respond.
- Review reporting adoption with the people who use it. Can a campaign manager find channel performance? Can an ecommerce lead trace revenue? Do leaders see consistent figures? Replace redundant reports with a concise shared view, and automate recurring data preparation where practical. This gives teams more scope to act on insights and less reason to repeatedly reconcile the same numbers.
CRM, marketing automation, and analytics stack components
A practical stack connects CRM, marketing automation, analytics and reporting around shared customer data. Product analytics tools capture useful events, funnels and segments; the wider stack also needs tools to store, activate and interpret those insights.
-
Map Stack Components
Assign each platform a clear function before connecting it. A CRM can hold contact and sales-stage records, while marketing automation manages email journeys and audience segments. Analytics tools track product events, and reporting tools turn those events into insights. Map the data each component creates and consumes, then avoid buying overlapping platforms that leave ownership unclear.
-
Design a Composable Stack
Choose a composable design that lets you replace or add components without rebuilding every workflow. For example, connect a CRM, automation platform and analytics layer through shared data definitions and interfaces. A control plane can coordinate permissions, integrations and data movement across those systems. Define who owns each connection, and avoid making one tool the only route between all components.
-
Select Product Analytics Tools
Choose product analytics based on the behaviour you need to understand. For a subscription product, track sign-up, activation and renewal events, then examine how each segment moves through the funnel. Assess whether the tool supports reliable event definitions, useful cohort analysis and connections to your CRM or automation platform. The right fit is the one that answers your growth question.
- Separate the stack into data collection, storage, analysis and activation. For example, event tracking records a feature use, a warehouse stores the event alongside customer data, and analytics identifies a pattern. Marketing automation can then use an approved segment for personalisation. Check that identifiers and event names stay consistent at every hand-off.
- Set rules for changes before the stack expands. Document the owner, purpose and data passed by each integration, such as a CRM-to-email sync for onboarding. Test one customer journey from event capture through reporting and activation. If an event is renamed, update every dependent workflow; otherwise, dashboards and automation may respond to different versions.
Auditing stack performance and decision speed
Audit the stack as a connected ecosystem, not a collection of isolated platforms. Trace one campaign from data capture to a decision, then identify delays, duplicated work and attribution gaps.
- Map every platform involved in one active campaign, from ad delivery to sales reporting. Record what each system contributes, who uses it and where data moves next. For example, trace a paid social lead through the CRM, nurture workflow and sales outcome. Mark manual transfers and repeated data entry, as both can slow the journey or introduce inconsistencies.
- Measure decision speed by following a real question through your team. If a campaign manager asks which channel produced qualified leads, note how long it takes to reach a usable answer. Include the time spent retrieving data, reconciling definitions and agreeing on an action. A report that arrives quickly but leaves teams debating its meaning still creates decision friction.
- Test data quality at key hand-offs. Compare campaign names, conversion events and customer identifiers across the advertising platform, analytics report and CRM. For example, check whether a lead marked as qualified in the CRM appears under the same campaign in reporting. Log missing records, duplicates and differences in definitions, then identify which connection or workflow causes each issue.
- Review attribution against the decisions it needs to support. Compare a campaign’s reported contribution with the customer journey across relevant touchpoints, and note where channel data is missing. Multi-touch attribution can help interpret several interactions, but teams still need shared definitions and suitable data. Record assumptions so stakeholders understand how the report assigns credit.
- Prioritise fixes by their effect on action, not by platform count. Remove a redundant transfer, clarify ownership of a metric or connect a disconnected source before adding another tool. The takeaway: simplify workflows that delay decisions.
Discuss a marketing analytics audit
Use the findings to set a clear baseline for ownership, data flow and reporting. Revisit it after changes so teams can see whether simpler workflows help them reach usable decisions with less friction.
Nodal AI: Performance Marketing Analytics
Nodal AI is a natural next step when fragmented marketing data makes performance difficult to interpret or slows decisions. The Nodal Platform helps turn business data into actionable intelligence, supporting teams that need a clearer view of performance, trends and customer journeys. It can help answer practical questions, such as which channels contribute to results and where customer journeys lose momentum.
Performance Marketing Analytics helps teams examine campaign activity through a connected performance lens. Multi-Touch Attribution and Customer Journey Mapping can help interpret how marketing interactions relate to outcomes across the journey. This is useful when a single-channel view doesn’t explain how customers discovered, considered and acted on an offer. The value is clearer analysis, not simply another dashboard.
Growth Recommendations help translate insights into potential next steps. For example, if analysis highlights a journey stage with weaker engagement, teams can use that finding to consider where to focus optimisation work. Recommendations support decision-making by making patterns more actionable, while strategic choices remain with the people who understand the business, audience and campaign context.
Automated Reporting can reduce reliance on repetitive manual reporting and make performance information easier to review. Teams can use reports to follow agreed measures, spot changes and bring campaign results into regular discussions. The key is to connect outputs with decisions: a report is useful when it helps a team identify what changed, understand why it matters and decide what to investigate next.
Consider Nodal AI when existing tools produce fragmented views, attribution feels unclear or reporting takes time away from analysis. Performance Marketing Analytics, predictive modelling, Customer Journey Mapping and Growth Recommendations can support clearer marketing decisions. Nodal AI is not a substitute for every part of a marketing operation; its role is to make data and performance insights more useful.
To make a conversation productive, bring the business question you need to answer, the marketing measures that matter and a description of where current reporting creates friction. This gives the discussion a practical focus: the data you need to understand, the journeys you want to analyse and the decisions the insights should support.
Contact Nodal AI to discuss your analytics needs
Make your next analytics decision count
Your next step doesn’t need to be a full rebuild. Choose one decision your team wants to make with greater confidence, then identify the data and analysis it requires. This focus can help you improve the parts of your growth marketing analytics stack that matter most, while keeping useful tools and workflows in place.
If you need support turning marketing performance data into a clearer direction, Nodal AI offers the Nodal Platform, Performance Marketing Analytics and Growth Recommendations. These help teams examine performance and bring insights into planning without losing sight of the business question behind the analysis.
Bring the challenge you want to solve and the decision you want to make faster. A focused conversation can help you explore a practical next step for your analytics approach.
Start with clarity, build on what works, and let better-informed decisions guide your next stage of growth.
Frequently Asked Questions
What are the essential components of a marketing tech stack?
Essential components include customer relationship management, campaign execution, measurement and reporting capabilities. The exact mix depends on how your organisation attracts and serves customers. For example, an ecommerce business may need transaction data alongside email campaign results, while a subscription business may prioritise product engagement and renewals. Add components when they fill a clear gap, and assign a business owner to each system’s data and outputs.
How should you choose a growth marketing analytics stack for a startup or business?
Start with the decisions your team needs to make, then select tools that provide the necessary inputs and analysis. A startup testing its first acquisition channels may need dependable campaign tracking and a clear view of sign-ups before adding advanced modelling. Consider integration effort, staff capability, data access and how easily tools can change as needs evolve. A lean setup works when every component has a defined purpose.
What tools connect marketing data across ad platforms, CRM, and product analytics?
Connectors, APIs and data integration platforms can transfer information between advertising accounts, CRM systems and product analytics. For example, data from Meta Ads, Google Marketing Platform and Google Analytics can be brought together with CRM outcomes for cross-channel analysis. A warehouse or customer data platform can provide a shared destination, while reverse ETL sends selected insights back into operational tools. Choose connections that preserve useful identifiers and field definitions.
How do you set up tracking, attribution, and dashboards for growth marketing?
Start by documenting the customer actions that matter, such as a completed registration, qualified enquiry or purchase. Give each action a consistent event name, then connect campaign identifiers to those events. Choose an attribution approach that reflects the journey you need to understand, and label its assumptions in the dashboard. For example, separate first-touch discovery from later interactions so teams can distinguish acquisition activity from conversion support.
How can you measure CAC, LTV, ROAS, retention, and conversion rates?
Use consistent definitions and time periods for each measure. Calculate customer acquisition cost (CAC) by dividing acquisition spend by new customers gained; calculate return on ad spend (ROAS) by dividing attributed revenue by advertising spend. Lifetime value (LTV) estimates customer value over the relationship, while retention tracks customers who remain active. Conversion rate is the share of eligible visitors or leads completing a defined action. Compare like-for-like cohorts.
What are the best product analytics tools for growth marketing?
Choose product analytics tools that capture useful events, funnels and segments, and connect them with your CRM, marketing automation and reporting through shared customer data.


