

Reach and engagement show activity, but attributed conversions indicate whether an influencer campaign contributes to business results. Tracking the impact of influencer marketing means connecting each creator’s content to the traffic, actions and sales it generates, then comparing the value attributed to the campaign with its total cost.
Clicks and purchases can appear in separate reports, leaving the path from a post to a sale unclear. Give each influencer a distinct UTM link or affiliate code, then bring traffic and conversion data together in your analytics. Attribution windows matter too: a short window can miss purchases made after someone has had time to consider an offer.
Learn how to measure ROI, attribute traffic and sales, and interpret engagement alongside commercial outcomes. This guide covers what to track with UTM links and affiliate codes, how tracking tools and attribution models connect customer touchpoints, and how to compare influencer marketing software by the quality of its reporting and insights. The goal is a clearer view of which activity creates value and where to focus your next decision.
Key Takeaways
- Give each creator a distinct tracking route so traffic and conversions can be linked to the right partnership.
- Assess campaign returns against clear commercial goals, not engagement figures alone.
- Use influencer-specific affiliate codes to identify sales that link-based tracking may not capture.
- Allow for delayed purchases and differences between platforms when interpreting performance data.
- Compare tracking tools by how clearly they connect creator activity to business outcomes and support future decisions.
Unique URLs and UTM parameters for traffic and conversion attribution
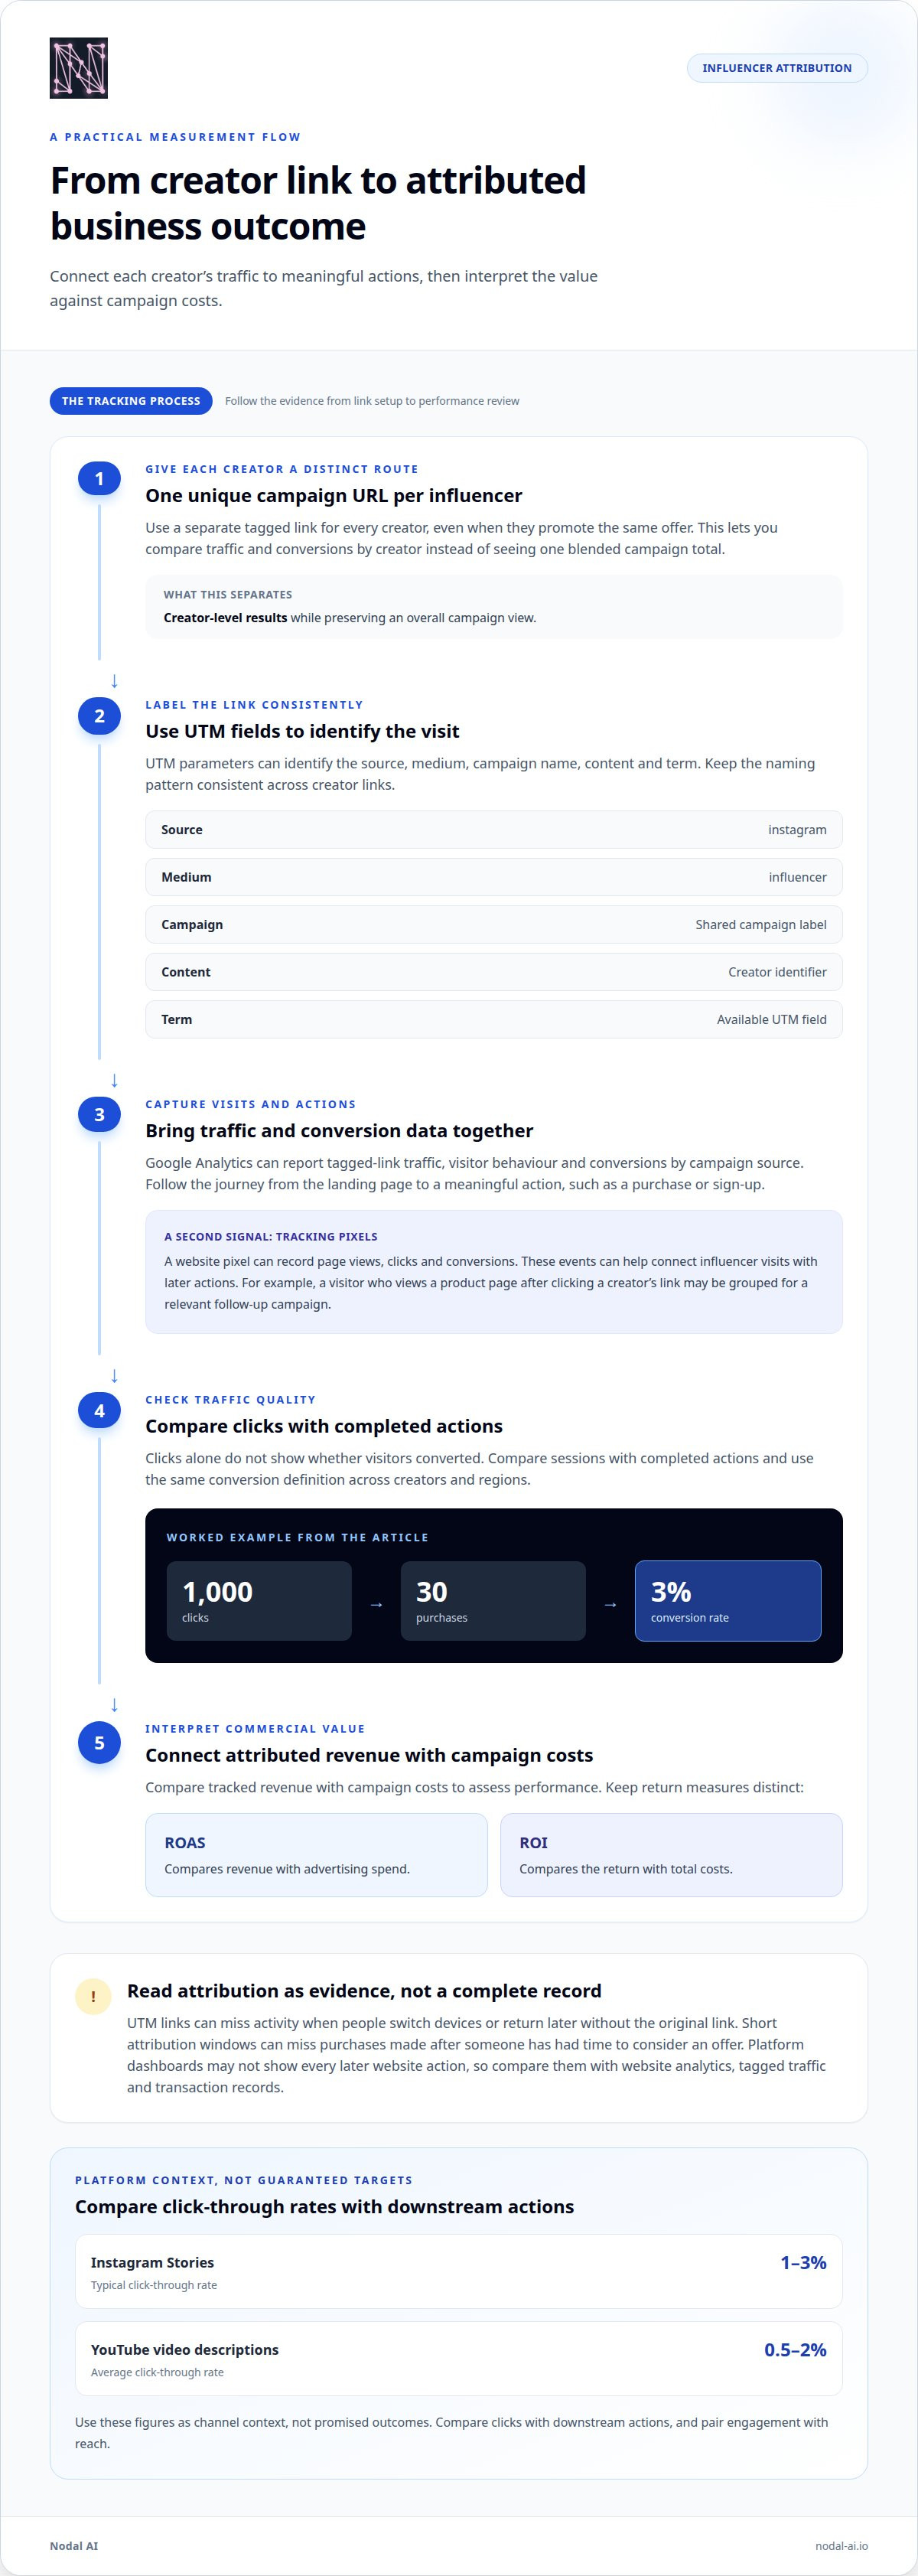
Give each influencer a distinct campaign URL. When a creator shares the link, its UTM parameters help analytics tools identify the visit’s source and campaign. Use a different URL for every influencer, even when they promote the same offer. This lets you compare traffic and conversions by creator instead of seeing one blended campaign total.
UTM parameters can identify the source, medium, campaign name, content and term. Keep the naming pattern consistent. For example, an Instagram link could use “instagram” as its source, “influencer” as its medium, and a shared campaign label. Add a creator identifier in the content field. This structure separates each person’s traffic while preserving the overall campaign view.
Google Analytics can use tagged links to report traffic, visitor behaviour and conversions by campaign source. Follow the journey from a landing page to a meaningful action, such as a purchase or sign-up. Compare sessions with completed actions, not clicks alone. A campaign with 1,000 clicks and 30 purchases has a 3% conversion rate, giving teams a clear way to interpret traffic quality.
Tracking pixels provide another view of the journey. Installed on a website, a pixel can record interactions such as page views, clicks and conversions. These events can help connect influencer visits with later actions and support retargeting audiences. For example, a visitor who views a product page after clicking a creator’s link may be grouped for a relevant follow-up campaign.
Revenue attribution connects tracked purchases to campaign activity, while cost figures show whether the activity was efficient. Compare tracked revenue with campaign costs to assess campaign performance, and treat return measures as distinct metrics. Keep the measures distinct: ROAS compares revenue with advertising spend, while ROI compares the return with total costs.
Acquisition metrics provide another useful lens. Track them alongside conversion rate and revenue, then compare results across creators. UTM links can miss activity when people switch devices or return later without the original link. Treat unique URLs as a consistent attribution signal, not a complete record of every influence.
How do you measure influencer marketing ROI?
Measure ROI by linking campaign costs and outcomes to clear commercial goals, then comparing performance across platforms, regions and creator types. Tracking the impact of influencer marketing also means checking that campaign content clearly discloses material connections with brands, as required by FTC rules in the United States.
Performance by Platform, Region, and Influencer Type
Comparing results across channels, audience locations and creator categories shows where campaigns contribute most. This helps distinguish a platform effect from a regional difference or creator-audience fit. For example, compare purchases from the same campaign by region, then assess whether engagement and conversions vary across creator types. Keep the goal consistent across comparisons.
Platform-Specific Metrics and Click-Through Rates
Platform-specific metrics show how people interact with influencer content and move towards a purchase. Instagram Stories typically see click-through rates of 1-3%, while YouTube video descriptions average 0.5-2%. Treat these as channel context, not guaranteed targets. Compare clicks with downstream actions, and pair engagement with reach to understand whether a post’s response reflects broad exposure or a highly engaged audience.
For each campaign, define the primary outcome before comparing platforms. A sales campaign might prioritise purchases and attributed revenue; a sign-up campaign can track completed registrations and content shares. Use the same conversion definition across regions and creators. Otherwise, a dashboard may make one platform appear stronger simply because its results use a different goal or reporting window.
Multi-platform attribution helps account for customer journeys that span several touchpoints. Someone might discover a product through an Instagram post, return through search, then purchase after seeing another creator’s content. A multi-touch model distributes credit across eligible interactions instead of assigning every conversion to the final visit. Compare that view with last-click reporting to see how the attribution choice changes your interpretation of the campaign.
Platform tracking has limits. Social platforms may show engagement and views without revealing every later website action, while device changes and delayed purchases can break a visible path. Treat platform dashboards as one source of evidence, then compare them with website analytics, tagged traffic and transaction records. Differences between systems can reveal missing touchpoints or incompatible attribution windows.
Privacy-related restrictions can also reduce the signals available for attribution. A missing user-level path does not mean an influencer had no effect; it means the available data may show only part of the journey. Use aggregated trends, campaign-level conversions and consistent measurement definitions. For example, compare regional purchase totals during campaign activity with the campaign’s tracked traffic, rather than assuming every sale can be tied to one viewer.
A consistent framework for tracking the impact of influencer marketing helps teams compare creator, platform and regional results. Native social analytics, web analytics, affiliate dashboards and multi-touch measurement tools capture different signals. Together, they can clarify where the customer journey is visible and where campaign reporting needs a broader view.
Influencer-specific affiliate codes for tracking sales and ROI
Affiliate codes connect a creator’s promotion with purchases made using that code. Used alongside links and analytics, they help distinguish sales from individual influencer partnerships and show which tracking sources capture conversions.
Influencer-Specific Affiliate Codes
An influencer-specific affiliate code is assigned to one creator, making code-linked sales easier to attribute. It is useful when audience members remember an offer but do not follow a tracked link. Give each creator a distinct code, then report its redemptions and associated sales separately. This provides a clearer sales signal, especially when influencer content moves between social posts, messages and conversations.
Links, QR Codes, and Promo Codes
These tracking methods capture different responses to the same promotion. UTM links identify tagged visits, affiliate links can associate referrals with a creator, and promo codes connect eligible purchases to a named offer. QR codes can track responses from connected-TV audiences by directing viewers to a campaign destination. Combining methods helps capture traffic and sales when an audience switches devices or does not buy in the first session.
Analytics and Affiliate Tracking Tools
Analytics and affiliate tracking tools organise clicks, referrals, code use and conversions into reports. Use the affiliate platform to review creator-level link activity and code redemptions, then compare those records with website analytics and completed transactions. This cross-check helps distinguish a click from a sale, rather than treating every tracked visit as revenue. Keep creator identifiers consistent across reporting sources.
Separate the purpose of each identifier. A creator’s affiliate link can record referral activity, while a promo code can capture a purchase without a recorded click. For example, a viewer sees influencer content on a television, scans a QR code on another device, then enters the creator’s code at checkout. Reviewing both the QR-linked visit and code redemption reveals more of that journey.
To assess returns, group recorded sales by creator and compare attributed revenue with the partnership’s total costs. Include relevant campaign expenses in the calculation rather than comparing sales with only one part of the spend. Affiliate commissions also affect the cost picture. Report revenue, conversions and costs together so teams can distinguish a creator who generates traffic from one whose audience completes purchases.
Set clear rules for duplicate attribution before a campaign launches. If a shopper clicks an affiliate link, later uses a creator’s code, then returns through another source, reporting needs a consistent way to assign credit. Apply the same rule across creators and campaigns, and keep code names distinct. This makes comparisons more useful and reduces confusion when several partnerships promote the same product.
Review affiliate reporting alongside engagement and audience response. A code with few redemptions may still help introduce a product, while strong engagement without tracked sales calls for a closer look at the purchase path. Compare the evidence across links, codes and completed transactions before changing creator investment. This combined view turns separate tracking signals into a more practical account of partnership performance.
Common tracking mistakes and platform-specific measurement
In the United States, FTC endorsement guidance calls for clear disclosure of material connections. Treat disclosure review as a publishing check, separate from ROI calculations.
Common Influencer Measurement Mistakes
Common measurement mistakes distort campaign results, including treating engagement as sales or applying inconsistent attribution rules. These errors can misdirect future budget decisions. For example, comparing one creator’s reach with another creator’s purchases mixes different funnel stages. Compare like-for-like outcomes, and report engagement, traffic and conversions separately.
Another mistake is judging a campaign only by its first-week performance. Influencer content can drive conversions 2-4 weeks after a post, so a short observation window may miss later actions. Set a consistent reporting period, then distinguish early signals, such as clicks, from completed purchases. This makes performance comparisons more meaningful across creators and channels.
Awareness and Brand Discovery Measurement
Awareness measurement tracks whether influencer content expands brand discovery rather than immediately producing a purchase. This matters when a campaign aims to introduce a product or brand. Compare brand mentions and reviews before and after campaign activity, then assess shares, reach and engagement together. Each metric reflects a different signal, so likes alone are not proof of awareness.
Social media comments can indicate that content resonated, but interpret them alongside reach and further audience actions. A short customer survey can add context by asking where respondents first heard about the brand. For example, a rise in mentions alongside survey responses naming a creator gives awareness reporting more depth than engagement totals alone.
Measurement Tools and Platform Differences
Native social media analytics, website analytics, affiliate dashboards and cross-channel measurement tools track different parts of influencer performance. Together, they help brands compare platform activity with website behaviour and conversions. For example, review Instagram shares alongside website visits and completed sign-ups. Keep each platform’s metric definitions visible, since a video view may not mean the same thing across channels.
Tools also differ in the signals they capture. Social platforms report activity within their own channels, while website analytics show what visitors do after arriving. Affiliate dashboards connect referrals with tracked sales. Bring these views into one reporting process, and label each data source so teams can distinguish platform-reported engagement from website-recorded conversions.
Influencer ROI Measurement Challenges
Influencer ROI compares campaign returns with campaign costs, but incomplete attribution and delayed purchases can complicate the result. This matters when brands use ROI to set budgets or assess creator partnerships. A short tracking window may miss later conversions; a longer one can reveal more of the customer journey, especially for considered purchases.
Privacy restrictions, device changes and untracked visits can leave gaps between exposure and purchase. Which tools track influencer marketing performance across platforms? Native social analytics, web analytics, affiliate dashboards and multi-touch measurement tools each capture different signals. What are common challenges and risks when measuring influencer marketing impact? Incomplete tracking, inconsistent metric definitions and short attribution windows can undercount contribution.
Influencer tracking software comparisons
Compare influencer tracking software by the decisions its reports support, not by feature counts alone. A useful comparison shows how campaigns generate traffic, engagement, conversions and revenue, then helps teams decide where to invest next. Start with the outcome you need to explain: creator discovery, sales attribution, or returns generated across several channels.
Different tool categories answer different questions. Social platform analytics report native engagement and views; affiliate tools track referrals and code-linked sales; website analytics show what visitors do after arriving. A central analytics platform can bring these sources into a broader performance view. For example, a creator discovery tool may help identify potential partners, but it will not necessarily show whether their content generated purchases.
Compare systems against the same practical criteria:
- Coverage: Can the tool combine social engagement, website actions and affiliate results?
- Attribution: Can reporting show creator-level outcomes and account for multiple customer touchpoints?
- History: Can teams compare past creator performance and the value generated by each post?
- Clarity: Can a marketer trace reported revenue back to its campaign and source?
These checks reveal whether a dashboard supports investment decisions or simply displays activity. Historical performance data can help brands identify valuable creators and plan future investment. Comparing a creator’s number of posts for selected brands with the value each post brings adds useful context to discovery. A high post count alone does not establish commercial value.
Reporting workload also matters. Manual spreadsheets can work for campaigns with 1-3 influencers, while automated dashboards can reduce repetitive reporting as data sources multiply. Automated influencer dashboards can cut reporting time by 80%. Treat that figure as a reporting-efficiency measure, not evidence that a campaign itself performs better. Check whether the dashboard’s outputs still make the path from activity to results understandable.
Match the software to campaign complexity. A small partnership programme may need basic link and sales reporting; a campaign across platforms, regions and creator types benefits from connected analytics. For example, if Instagram engagement rises but attributed revenue does not, a combined view can help distinguish a discovery result from a sales result. That distinction makes budget reviews more grounded.
Make the final comparison using a real reporting task. Ask each shortlisted system to show how it would trace one creator’s content through engagement, traffic and revenue, then compare the insights it produces. Choose the tool that makes sources and assumptions visible, supports consistent comparisons, and turns past results into clearer decisions for future campaigns.
Discuss influencer tracking analytics
Nodal AI: Performance Marketing Analytics
Nodal AI’s Performance Marketing Analytics helps bring fragmented campaign data into a clearer view of performance. Turn influencer activity’s tracking signals into insights for analysing customer journeys, attribution and results. It is a natural next step when separate reports make it difficult to understand how marketing activity contributes to business outcomes.
Through the Nodal Platform, teams can use Automated Reporting and Growth Recommendations alongside their analytics. These capabilities help organise performance information and inform decisions about future marketing activity. Use them when you need a more connected picture of campaign performance, rather than another isolated report.
Contact Nodal AI to discuss your performance analytics needs.
Turn measurement into your next decision
Use what your campaign data reveals to shape the next partnership, not simply to judge the last one. Tracking the impact of influencer marketing is more useful when measurement informs a clear decision: which audiences to prioritise, where to refine attribution, or which outcomes deserve closer attention. Let the evidence guide the next test, and keep goals consistent so results remain meaningful over time.
Nodal AI’s Nodal Platform brings together Performance Marketing Analytics and Growth Recommendations to help organisations turn marketing data into actionable insight. Use this approach when fragmented reporting makes it harder to connect campaign performance with customer journeys and business outcomes. Greater visibility can help teams make more considered decisions about future activity.
Build on what the data shows and make your next marketing decision with greater clarity.
Frequently Asked Questions
What metrics should be used to measure influencer marketing impact?
Choose metrics that match the campaign’s goal and the customer’s stage. For discovery, assess reach and branded searches; for consideration, examine saves, qualified visits and product-page activity; for conversion, track completed orders, revenue and new-customer share. A creator may generate engagement without sales, so report early indicators separately from commercial outcomes. This keeps one headline figure from hiding what the campaign actually achieved.
How do you track influencer marketing conversions and sales?
Connect campaign interactions to completed transactions, then reconcile attributed orders with checkout records. Use creator identifiers in campaign reporting and include order status so cancelled or refunded purchases are not counted as retained sales. For purchases that links or codes do not capture, a post-purchase survey can provide useful context. Report attributed orders separately from all sales during the campaign period to avoid implying every purchase came from an influencer.
What attribution models work best for influencer campaigns?
No single attribution model suits every campaign. Last-touch credit is straightforward but can overlook creators who introduced a customer earlier. First-touch highlights discovery, while linear attribution distributes credit across recorded interactions. Compare models with the customer journey and campaign objective: a discovery campaign may value the first interaction, while a sales analysis may examine several touchpoints. Keep the chosen model consistent when comparing campaigns.
How do you calculate influencer marketing ROI and cost per acquisition?
Calculate ROI by subtracting total campaign costs from attributed returns, dividing the result by those costs, then expressing it as a percentage. Calculate cost per acquisition by dividing acquisition spend by the number of new customers gained. Include relevant creator fees, commissions and campaign expenses in the cost base. Define “acquisition” before reporting, since a first-time customer and a repeat purchase represent different outcomes.
What are typical influencer marketing engagement and conversion benchmarks?
Benchmarks depend on platform, content format, audience and campaign objective, so a broad industry average may mislead. Compare a creator’s results with similar campaigns on the same platform, using the same engagement definition and conversion window. For example, assess video views against video views, not story reach. Treat benchmarks as context for investigation, then use your own comparable campaign history to guide targets.
How can brands measure brand awareness and sentiment from influencer campaigns?
Combine indicators of exposure with evidence of audience response. Track changes in brand mentions, branded search activity and review volume around campaign activity, then examine comments for recurring themes. Classify feedback as positive, neutral or negative using consistent criteria, and review ambiguous comments separately. A short customer survey can add another signal by asking how respondents discovered the brand and what impressions they associate with it.
How do UTM links, promo codes, and affiliate links track influencer results?
Each method records a different kind of response: tagged links identify campaign visits, affiliate links associate referrals with creators, and promo codes connect eligible checkouts with an offer. Assign distinct identifiers and use a shared campaign naming structure. Then reconcile recorded visits, code use and transactions without counting the same sale twice. Differences between these records can reveal purchases that followed influencer exposure but did not use the original link.
How do you compare influencer marketing impact with paid social and other channels?
Compare channels against the same business goal, such as new customers, qualified leads or attributed revenue. Use consistent cost definitions, conversion criteria and attribution periods, then separate direct response from awareness signals. Paid social may provide clearer in-platform delivery data, while influencer activity can include audience responses that are harder to trace directly. A shared reporting framework helps show each channel’s contribution without treating unlike metrics as equivalent.


