

A prospect’s return visit can be more than a click. Understanding what a revenue signal is means recognising observable data that can guide revenue decisions, not proof that a deal will close. Some signals are explicit, such as a demo request; others are implicit, such as a pattern of changing engagement. Both can help teams spot developing opportunities or identify customers who may need attention.
Signals are useful, but they can mislead when viewed in isolation. A single action needs context: who took it, what is happening across the account, and whether similar activity has previously led to meaningful revenue outcomes.
Learn to distinguish explicit and implicit signals, identify useful examples, and turn them into timely, practical actions. We’ll also look at how to connect each signal to account context, decide who should respond, and build insights into everyday revenue decisions so scattered activity becomes a clearer path to action.
Key Takeaways
- Distinguish explicit actions, such as a demo request, from implicit patterns that need more context.
- Connect each signal to the account, buyer and revenue situation before deciding what it means.
- Prioritise signals that have repeatedly preceded qualified pipeline or closed-won business.
- Turn useful insights into clear next steps for the right person, at the right time.
- Bring together behavioural, product, customer and CRM data to spot opportunities and risks more clearly.
1. Definition of explicit and implicit revenue signals
A revenue signal is an observable data point that helps a revenue team decide where to focus. It may suggest that a buyer is progressing, an existing customer could expand, or an account needs attention. A signal is an input, not proof of a sale or a forecast on its own. For example, a demo request indicates interest, but does not establish budget, fit, or purchase timing.
Revenue signals include explicit actions and implicit patterns. An explicit signal is a clear, intentional action, such as requesting a product demonstration, asking about a contract, or replying to a sales email. An implicit signal is a pattern that needs interpretation, such as a known contact returning to a pricing page or several stakeholders engaging with product information. The distinction matters: explicit activity often points to stated intent, while implicit engagement needs account context.
Buying signals relate to purchase interest or evaluation. Revenue signals have a broader role: they can inform lead qualification, pipeline decisions, customer expansion, and retention. For instance, reduced product use may indicate retention risk, while repeated interest from different departments could point to a wider opportunity. Teams can also define organisation-specific signals based on their customer journey and workflows.
A Revenue Signal Engine processes data, detects relevant patterns, and helps teams decide what action to take. It can combine analytics from several sources, then surface an alert or recommendation for a person or workflow. For example, an engine might connect renewed product engagement with an open account opportunity. Its output depends on the inputs and rules used; regular updates help keep signals aligned with changing behaviour.
Tools for tracking signals include CRM systems, analytics platforms, and revenue intelligence solutions. Tool costs depend on functionality, data volume, integration needs, and deployment; a tailored price is provided after a quote request.
How accurate are revenue signals? Their quality depends on complete, current data, reliable identity matching, and context such as account activity. Teams can improve accuracy by comparing signals with outcomes and refining definitions when patterns produce false positives.
What are the privacy and compliance risks in the U.S.? Collecting unnecessary personal data, unclear data access, excessive retention, or using information beyond its intended purpose can create risks. Limit access, document how signals are used, and include privacy review in the data workflow.
Explicit actions, implicit patterns, and organisation-specific triggers can indicate that a buyer is moving closer to a decision, a customer is pulling away, or a revenue opportunity is developing. The signal type describes how it is observed; its possible meaning depends on the situation. A clear action may show stated intent, while a pattern or locally defined trigger still requires interpretation. None should be treated as a confirmed outcome.
Buying signals specifically relate to purchase interest or evaluation, while revenue signals can also inform qualification, pipeline, expansion, or retention. Keeping the distinction clear helps teams avoid applying a narrow purchase-interest label to every useful indicator. In all cases, a revenue signal is an input rather than proof of an outcome. It can guide judgement and action, but does not establish that a deal, renewal, or other outcome will occur.
2. Turning signals into actionable insights
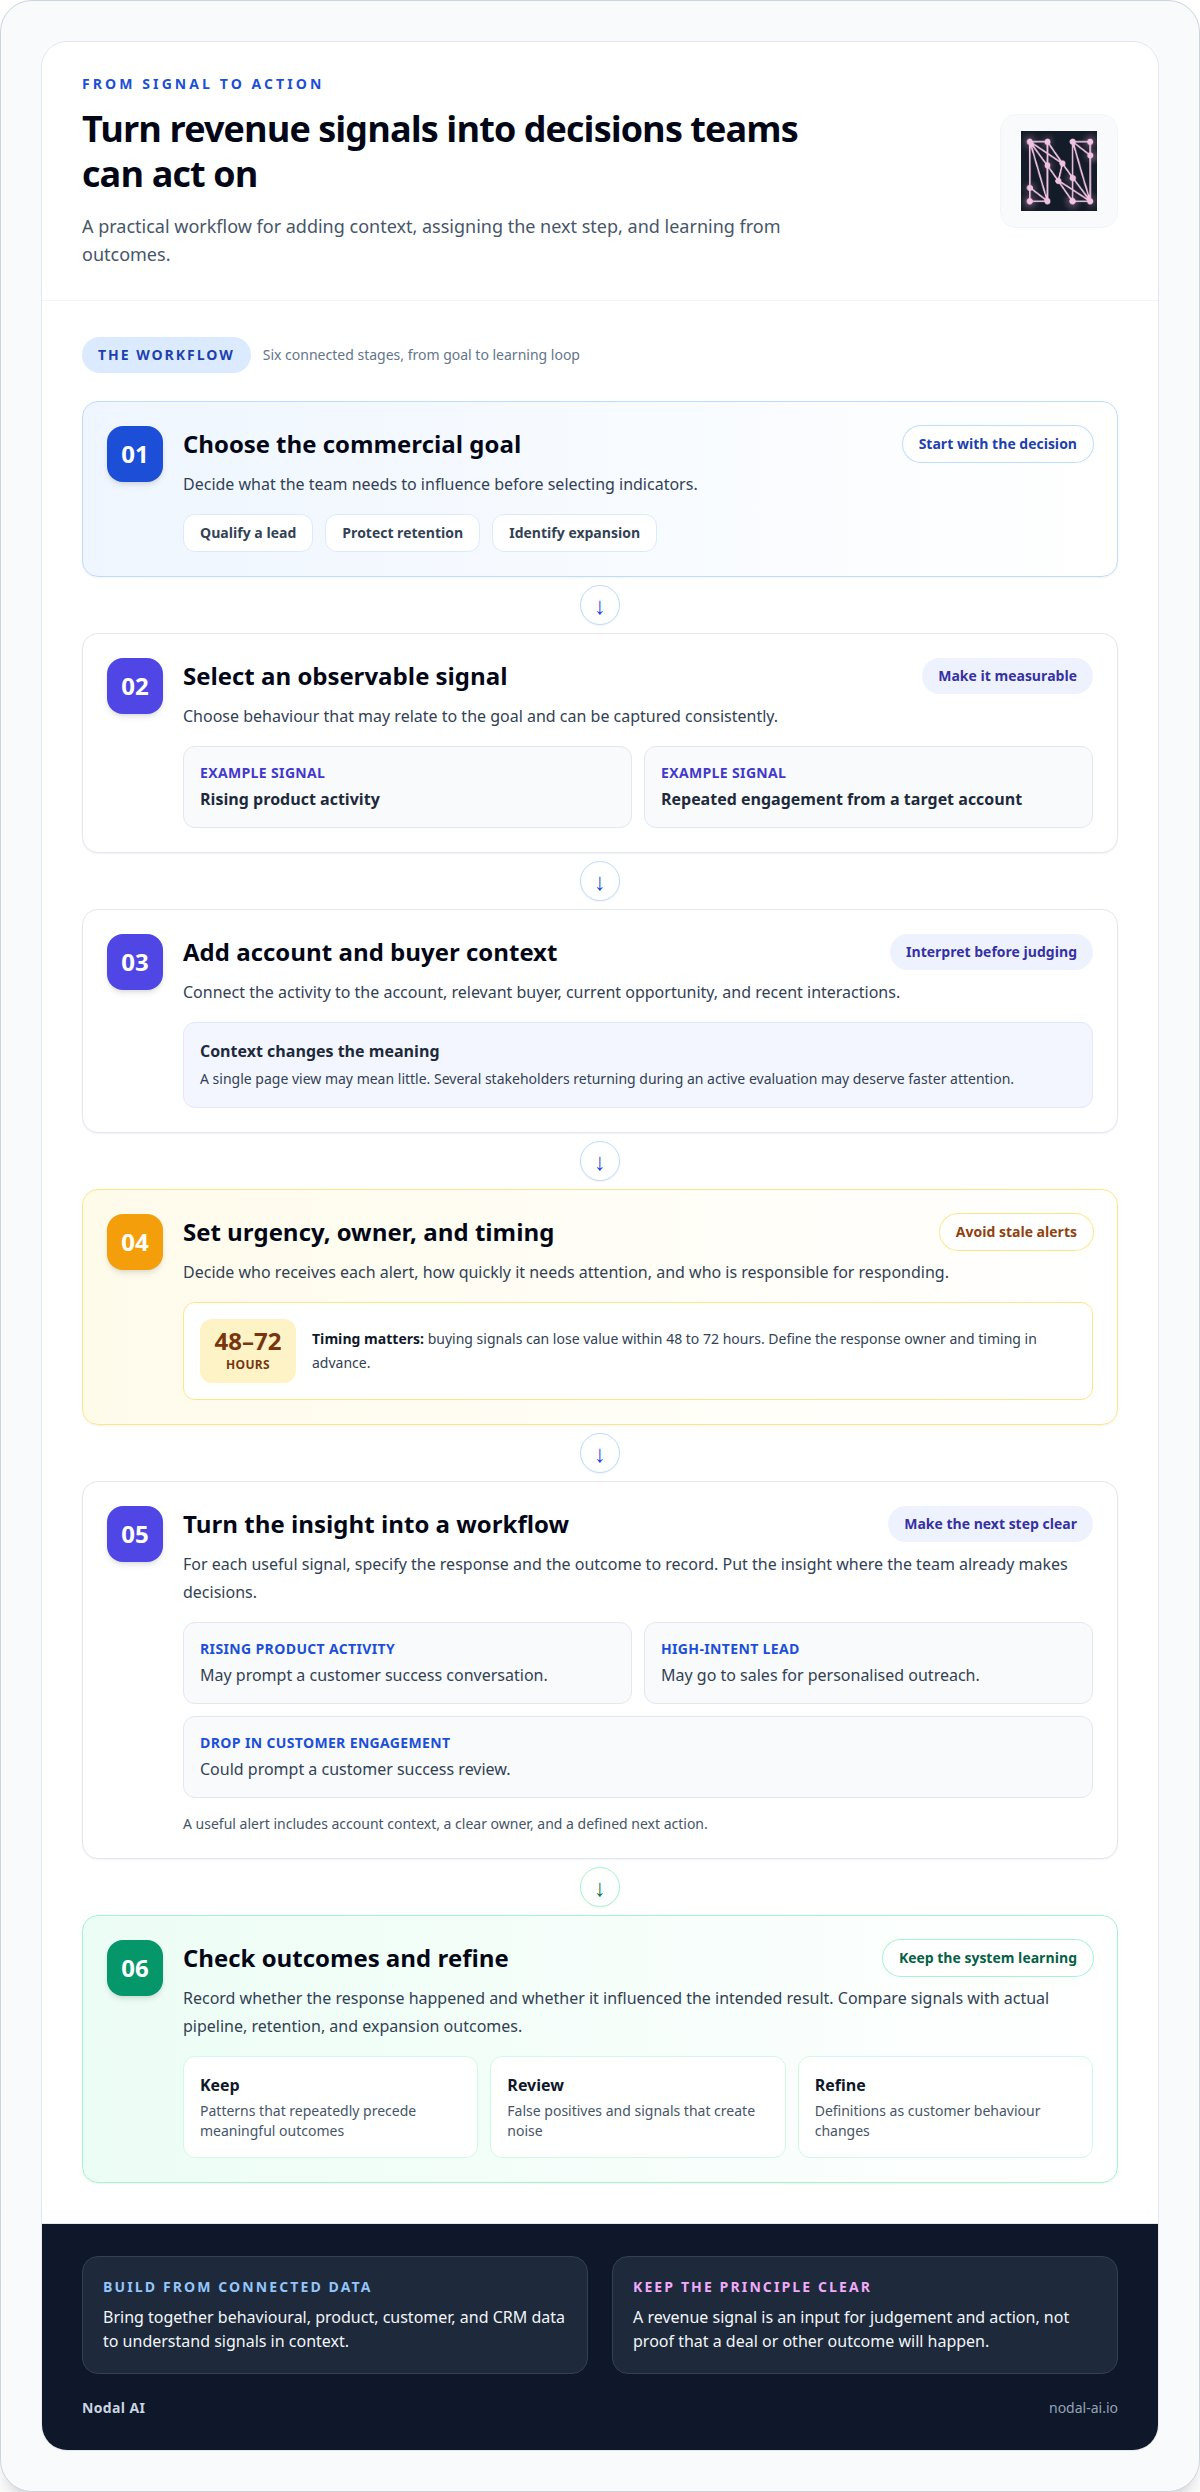
A signal creates value only when it changes a decision. Start by linking each indicator to a specific commercial goal, such as qualifying a lead, protecting retention, or identifying an expansion opportunity. For example, rising product activity may prompt a customer success conversation, while repeated engagement from a target account could justify a tailored sales follow-up.
Next, add context before assigning urgency. Connect the activity to the account, relevant buyer, current opportunity, and recent interactions. A single page view means little without that context; several stakeholders returning during an active evaluation may deserve faster attention. Buying signals can lose value within 48 to 72 hours, so define who receives each alert and what happens next.
Turn interpretation into a workflow. For each useful signal, specify its owner, response, timing, and the outcome to record. A high-intent lead might go to sales for personalised outreach, while a drop in customer engagement could prompt a customer success review. Without a clear action, an alert risks becoming noise rather than useful intelligence.
How can businesses build a revenue signal system? Choose a strategic revenue goal, identify observable behaviours that may relate to it, then connect the required data sources and define a response for each indicator. Test the rules against actual pipeline, retention, and expansion outcomes, and refine the system as customer behaviour changes.
Keep the first version focused. Select signals teams can capture consistently and link to a measurable outcome. Compare how often a signal precedes a qualified opportunity or customer renewal with cases where it does not. This helps distinguish meaningful patterns from coincidence and reduces false positives that can distract sales and customer success teams.
Make insights visible where decisions already happen. An alert buried in a separate analytics platform may arrive too late or lack an owner. Instead, connect the signal to an existing workflow, provide account context, and give the recipient a clear next action. Review whether the action happened and whether it influenced the intended result.
Finally, treat the system as a learning loop, not a one-off setup. Review signal quality with sales, marketing, and customer success; remove indicators that repeatedly create noise. Customer journey mapping can help teams connect interactions across stages, giving revenue signals a clearer place in the customer journey.
A Revenue Signal Engine combines real-time data processing and machine learning to predict revenue trends and produce actionable insights. Integrate these insights into everyday business processes so they can inform decisions. Lifecycle milestones can create time-bound opportunities for action, making it useful to connect each signal to a response at the relevant point in the customer journey.
A revenue signal becomes more useful when connected to account, buyer, deal, and broader revenue context, delivered to the right person at the right time, and tied to a specific action. Revenue signals can help prioritise high-intent leads, personalise outbound activity, spot early deal risk, improve forecast accuracy, align buying groups, and support retention and expansion. Retail businesses can use predicted revenue signals to optimise inventory and promotions.
3. What are examples of revenue signals?
Revenue signals can appear before a sale, during a customer relationship, or beyond direct buyer interactions. Grouping them by the activity they describe helps teams recognise patterns and consider what each might mean. A useful example is not automatically a useful signal: its value depends on its relevance to a particular revenue goal.
- Behavioural engagement: A known contact returns to a product page, or a prospect starts interacting with new material. These actions can indicate renewed interest, especially when they align with an active evaluation.
- Product usage: A customer explores a feature they had not used before, or product activity shifts across teams. Such patterns may point towards an expansion conversation, though the account context matters.
- Lifecycle milestones: A contract renewal approaches, or an account reaches a planned onboarding milestone. These events give teams a timely reason to review customer needs and next steps.
- Risk alerts: A customer stops attending scheduled reviews, or support conversations reveal a recurring obstacle. Either pattern can prompt a closer look at retention risks and the response needed.
- Custom signals: A company may track a change in lead score or a newly created opportunity. These indicators are most useful when teams can relate them to past sales outcomes.
Before a sale, a known contact becoming active again can bring an account back into focus. A score change may also flag a shift in fit or engagement. Treat both as prompts for investigation, not automatic instructions to make contact. Review recent conversations, account activity, and the opportunity stage before choosing an appropriate response.
After a sale, renewed interest in a product area may suggest room for expansion. For example, a customer asking about a capability used by another department could open a relevant discussion. By contrast, a pattern of missed check-ins may signal a need to understand an obstacle. These examples show why revenue signals can support growth and retention, not just new-customer acquisition.
Signals can also come from outside a company’s direct sales and product systems. The U.S. Environmental Protection Agency notes that voluntary buyer commitments to procure renewable energy can signal future revenues to developers and investors. Here, a buyer commitment indicates potential demand, rather than proving that a particular transaction has closed.
To make examples useful, connect each one to a business question. Does a score change often precede qualified pipeline? Does renewed product interest lead to expansion discussions? Comparing signals with actual outcomes helps teams decide which patterns deserve attention, which need more context, and which create noise.
4. How do companies identify and measure revenue signals?
Start with a revenue outcome, then work backwards to the activity that may precede it. For example, a team seeking expansion opportunities could examine which customer changes often come before a larger purchase. A customer saying they are hiring 10 more representatives this quarter is an organisational growth signal worth assessing. It suggests potential need, not an automatic upsell.
Gather candidate signals from buyer behaviour, product use, customer activity, sales conversations, and CRM changes. Then define each signal precisely. “Engagement increased” is too broad to measure consistently. A clearer definition might specify which product activity changed, whose account it belongs to, and which customer stage it concerns. Clear definitions help teams compare patterns instead of relying on individual interpretations.
Next, assess how a signal moves through the organisation. A signal audit can ask whether it is systematically captured, delivered to representatives with context, triaged for urgency, and linked to an action. For example, a change in an opportunity record might need an account owner, a reason code, and a follow-up task. If any step fails, the signal may not support a timely decision.
Context is essential. A single event shouldn’t trigger a major decision without considering who performed it, account activity, company fit, and CRM history. A product action from an established customer may mean something different from the same action by a new prospect. Review surrounding activity before treating an alert as evidence of intent or risk.
Measure signals against real outcomes. Compare activity with later results, such as qualified pipeline or closed-won business. Give more weight to patterns that repeatedly appear before those outcomes. A signal that occurs often but rarely precedes a meaningful result may need a narrower definition or a different response. Track false positives too: frequent irrelevant alerts can weaken trust in the system.
Revenue Signal Engines combine data collection, signal detection, and decision-support systems to process inputs from multiple sources. They can help identify emerging buying patterns, revenue anomalies, and churn risks. Their usefulness depends on complete, high-quality data: inconsistent account records or missing activity can distort detected patterns. Review data quality alongside signal performance instead of treating model output as an independent verdict.
Finally, revisit the rules as customer behaviour and business priorities change. If a signal once predicted qualified pipeline but no longer does, investigate changes in the buying process, account mix, or CRM recording. Keep signals that support measurable decisions, adjust those that lack context, and retire those that create noise. This makes signal identification and measurement an ongoing part of revenue operations.
5. What data sources provide revenue signals?
Revenue signals draw on records of buyer behaviour, customer needs, and market shifts. Sales transactions can show changes in deal size or purchase frequency. Customer interactions can reveal questions, concerns, or renewed interest. Market trends and external economic indicators add context, helping teams interpret account activity against conditions beyond their own systems.
Buyer behaviour provides direct clues about evaluation and intent. Website engagement, content responses, event attendance, and product enquiries can show which topics attract attention. For example, repeated engagement with material about a particular solution may help a team understand a prospect’s priorities. The activity is more informative when connected to the buyer, account, and current opportunity.
CRM changes show how a sales relationship develops. New contacts, changes to opportunity stages, updated close dates, and recorded interactions can all contribute signals. A newly added stakeholder, for instance, may indicate that an account’s buying group is changing. Fit data, such as alignment with a company’s target customer profile, helps distinguish relevant activity from engagement unlikely to lead to a suitable opportunity.
Customer engagement and product activity add the post-sale perspective. Account conversations, support interactions, and changes in product use can help teams understand customer needs. A request for information about another use case may create an opening for an expansion discussion. A pattern of unanswered outreach, by contrast, can prompt a closer retention review. These inputs are most useful alongside account history, not as isolated events.
External sources broaden the view. Market trends can show changes in demand, while competitor activity may affect how buyers evaluate options. Economic indicators can help explain shifts in purchasing behaviour across a sector. For example, a revenue team could compare slower opportunity activity with broader market changes before deciding whether an individual account needs a different response.
Combining sources makes patterns easier to interpret, but integration requires consistent records. If a contact appears under different names in CRM and engagement data, activity may be split across profiles. Teams can improve the view by connecting records to the right account, keeping key fields consistent, and noting where each signal originated. This also makes it easier to trace an insight to its supporting evidence.
Choose sources according to the decision they should support. A pipeline review may rely on opportunity activity and sales conversations, while retention planning may use customer interactions and product engagement. Start with relevant inputs, then compare their signals with actual outcomes. This keeps the data set focused and helps teams avoid collecting activity that cannot inform a practical action.
Explore connected analytics features
Nodal AI: Nodal Platform
Nodal AI’s Nodal Platform helps businesses turn fragmented data into actionable intelligence for performance tracking, trend identification, and faster decisions. When revenue signals are spread across marketing channels and customer interactions, Performance Marketing Analytics can help bring campaign performance into clearer focus. Growth Recommendations support teams in deciding where to direct attention, while Automated Reporting reduces the need to compile updates manually. Turn scattered indicators into a more coherent view, then use that view to guide your next business decision. To explore whether Nodal Platform fits your needs, contact Nodal AI to discuss a demo.
Make your next revenue decision clearer
Understanding what a revenue signal can tell you is only the starting point. Next, make signal quality part of your team’s decision-making: ask which evidence changed the decision, what action followed, and what the outcome revealed. This reflection creates a practical learning loop, rather than another dashboard to monitor.
Choose one recurring decision where better context could help. Make the evidence visible to the people responsible, record the action they take, and review whether it supported the intended outcome. As the team learns, refine how it interprets signals and where it focuses attention.
For organisations ready to connect fragmented information with clearer commercial decisions, Nodal AI can help make the next step more manageable. Bring your questions about revenue signals and explore a useful path forward.
Start with one decision, learn from the evidence, and build from there.
Frequently Asked Questions
What does revenue signal mean in business?
In business, a revenue signal is a clue that helps teams decide where to investigate or act. It differs from a revenue result, such as a completed sale, because it can inform a decision before the outcome is known. For example, a marketing team might compare campaign engagement with later bookings to decide which audience merits further analysis, rather than treating engagement itself as revenue.
How are revenue signals used in sales and marketing?
Sales and marketing teams use revenue signals to coordinate decisions across the customer journey. Marketing can compare audience and campaign activity with downstream commercial outcomes, then share useful patterns with sales. Sales can use those insights to shape account planning or follow-up priorities. A shared definition of success, such as qualified opportunities or completed purchases, helps both teams assess whether their actions contribute to the same business goal.


