

The cheapest channel isn’t always the best route to growth. Customer acquisition cost (CAC) is the total cost of acquiring customers divided by the number of new customers gained during a set period. Comparing customer acquisition cost by channel shows where acquisition spend goes and which routes bring in customers efficiently.
It’s easy to focus on campaign spend alone, but a useful CAC comparison requires consistent measurement. Count acquisition costs and new customers using the same criteria, then account for each channel’s role in the customer journey.
This article explains what CAC includes, why costs differ across paid, organic and referral channels, and how to interpret those differences without mistaking a low figure for sustainable growth. It also covers how tracking the full journey and diversifying traffic sources can help your business decide where to focus next.
Key Takeaways
- Compare channels using consistent cost and customer definitions to make performance differences meaningful.
- Look beyond ad spend: sales effort, tools, incentives and shared overhead can all shape acquisition costs.
- Assess acquisition efficiency alongside customer lifetime value, not as a standalone figure.
- Interpret channel benchmarks in context: business model, audience and sales process all influence CAC.
- Use joined-up performance insights to spot growth opportunities and make more informed decisions about traffic sources.
What is Customer Acquisition Cost (CAC)?
Customer acquisition cost measures what a business spends to gain new customers. Calculate it by dividing acquisition costs by the number of new customers acquired during the same period. Include relevant marketing campaigns, sales salaries and commissions, CRM software, sales tools, promotions, discounts and a proportional share of overhead. Consistent inputs make comparisons more useful.
For example, a business that spends $100,000 on acquisition in a month and gains 500 customers has a CAC of $200 per customer. Count new customers consistently, using the same criteria for what qualifies as an onboarded customer. Otherwise, a change in the counting method can make CAC appear to rise or fall without a real change in performance.
Customer lifetime value estimates the value a customer contributes over the relationship. One example uses a customer spending $100 per month, buying 12 times a year, and staying for 3 years: the resulting lifetime value is $3,600. Compare that estimate with acquisition cost to see whether the customer relationship can support the expense of gaining them.
Lifetime value also varies across business types. A dataset covering 2022-2024 reported average lifetime value of $32,414 for B2B companies and $10,089 for B2C companies. These figures describe different customer contexts, not a target every business should adopt. Deal size, purchase frequency, retention and revenue model all affect what a customer may be worth.
The customer lifetime value to CAC ratio puts those measures side by side. The inverse CAC-to-lifetime-value notation expresses the same relationship as 1:3. A ratio below that benchmark can prompt closer review of acquisition spending, customer value, or both.
Use CAC as a decision aid, not a standalone verdict. A higher lifetime value can support a higher CAC, while a low CAC may still be inefficient if customers contribute little over time. The ratio also depends on comparable periods and consistent cost definitions. If you compare monthly acquisition costs with an estimated lifetime value, make the assumptions behind both measures clear.
To compare customer acquisition cost by channel, apply the same calculation to each channel and connect customer outcomes to the journey that led to conversion. Customer Journey Mapping can help organise those touchpoints, while clear definitions keep the comparison grounded. Assess acquisition cost alongside customer value to decide which programmes merit closer attention.
Digital advertising, SEO, SEM, and content marketing
Paid and organic channels attract customers in different ways, so their CAC can differ. Compare costs with conversions and customer value, not clicks alone.
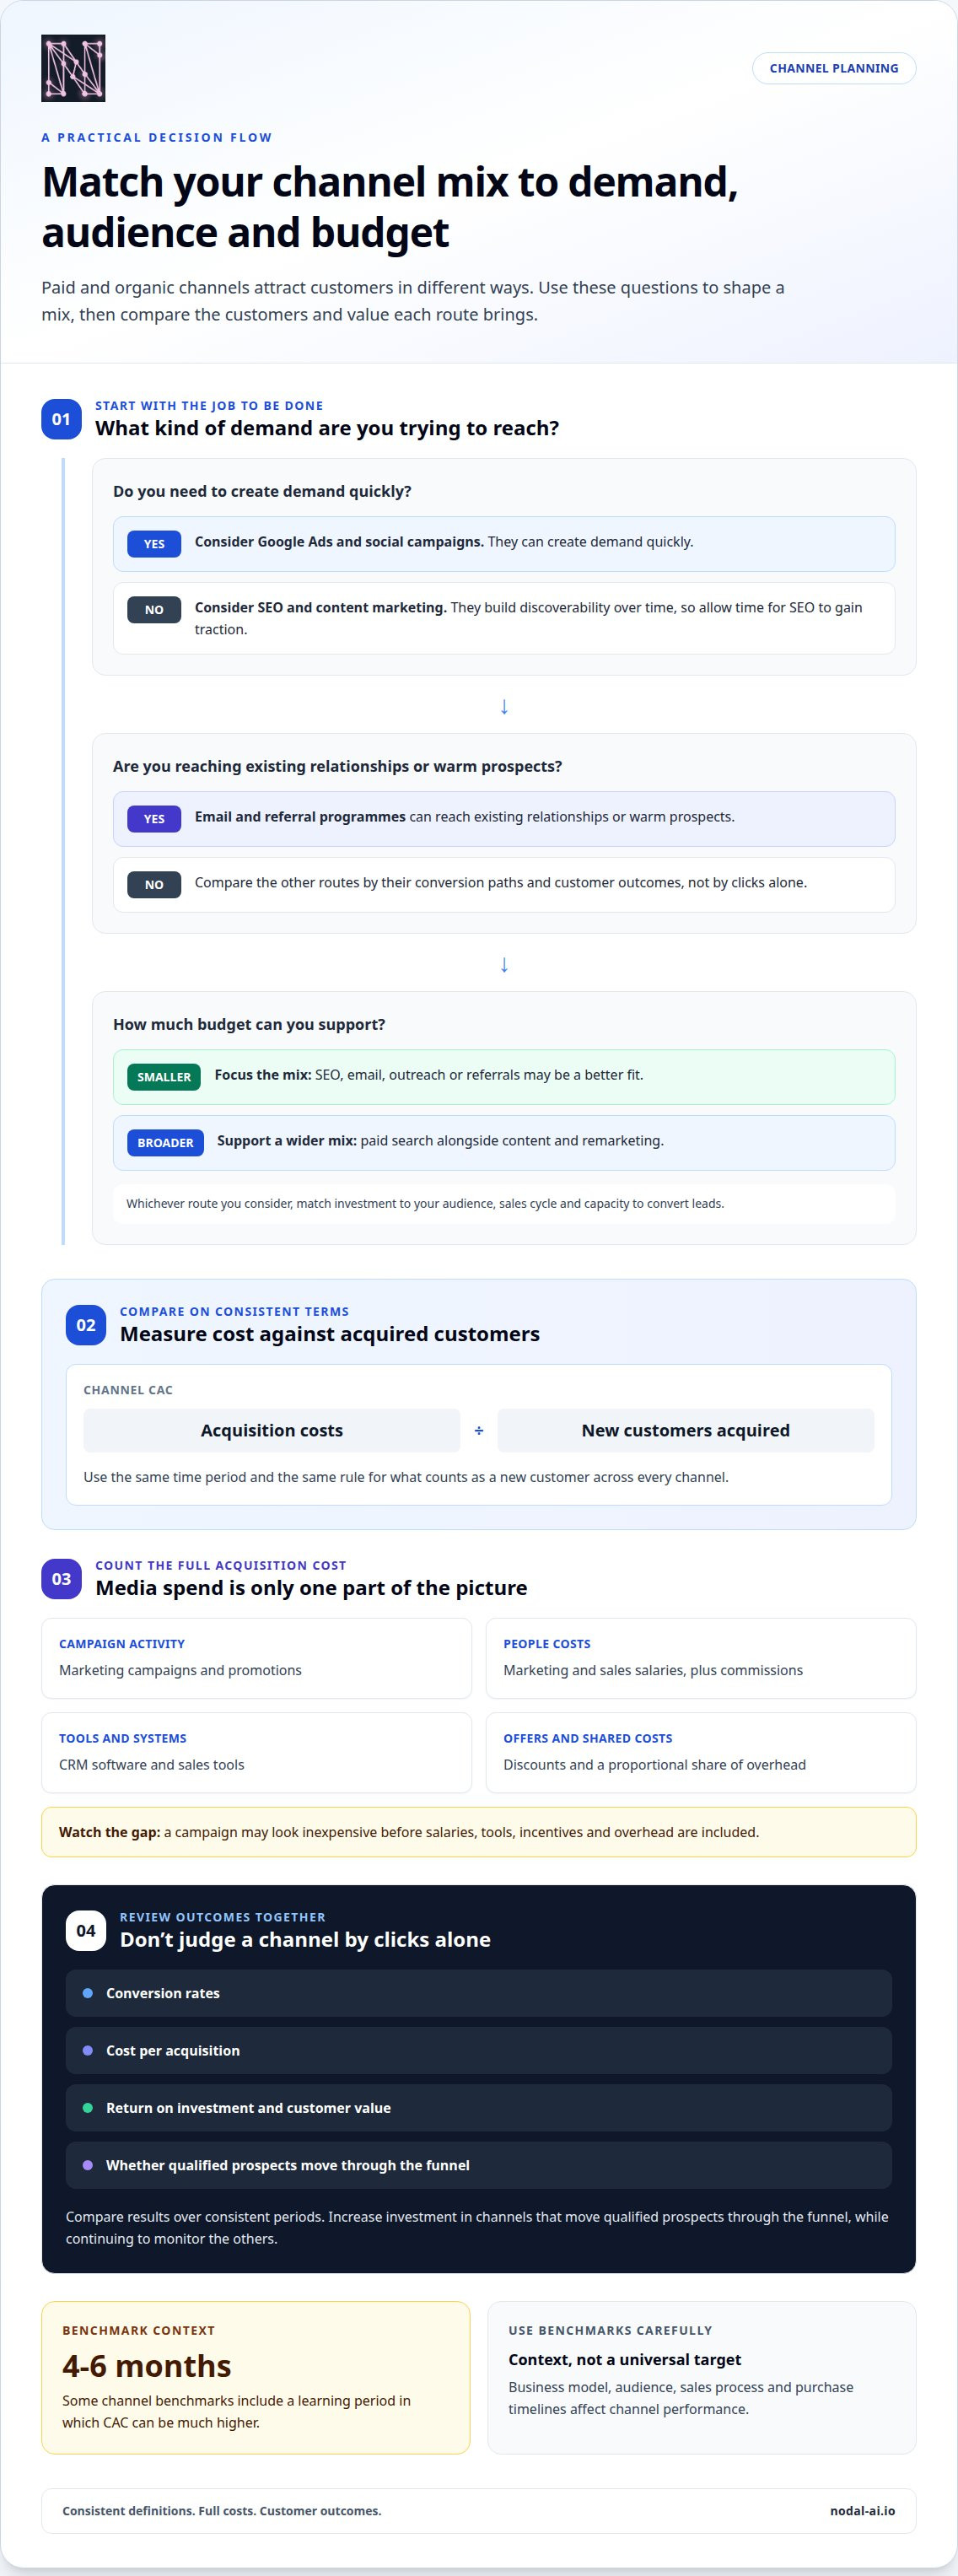
Google Ads and social campaigns can create demand quickly, while SEO and content marketing build discoverability over time. Email and referral programmes reach existing relationships or warm prospects. Because each channel has different costs, conversion paths and purchase timelines, compare spending with the customers it acquires.
Channel Performance and Budget Allocation
Compare each channel’s costs and customer outcomes to guide investment. Click volume alone doesn’t show which activity attracts customers efficiently. Review conversion rates, cost per acquisition and return on investment together. Then consider increasing investment in channels that move qualified prospects through the funnel, while continuing to monitor the others.
CAC Benchmarks by Marketing Channel
CAC benchmarks report acquisition costs for particular channels and customer types. They offer context, not a universal target.
Individual channel figures also vary. These benchmarks include a 4-6 month learning period, when CAC can be much higher.
Use your monthly marketing budget to shape a workable channel mix rather than assuming one channel is right for every business. A smaller budget may favour focused SEO, email, outreach or referrals; a broader budget can support paid search alongside content and remarketing. Match investment to your audience, sales cycle and capacity to convert leads. Allow time for SEO to gain traction.
Calculate channel CAC using acquisition expenses, not media spend alone. Include campaign costs, marketing and sales salaries and commissions, CRM software, sales tools, promotions, discounts and a proportional share of overhead. A campaign may look inexpensive before these costs are counted, then appear less efficient once the full cost of acquiring customers is included.
Compare results over consistent periods and customer definitions. Performance Marketing Analytics can bring channel measures into a clearer view, helping teams assess spend alongside outcomes. Explore performance marketing analytics when you need a more joined-up way to interpret campaign performance.
Challenges in calculating customer acquisition costs
CAC sounds straightforward, but there’s no single official industry standard for calculating it, nor a customer acquisition cost account in the uniform system of accounts. As a result, two teams can report different figures for the same period. One may count advertising alone; another may include sales salaries, software and overhead. The number is useful only when its boundaries are clear.
Start with a defined period, a consistent customer rule and a complete set of costs. Divide the acquisition costs for that period by the new customers acquired under the same rule. For example, decide whether a customer counts when they sign a contract or complete onboarding. Changing that threshold between reporting periods can distort CAC, even if spending and conversion activity remain steady.
Cost allocation creates another challenge. Marketing campaigns, sales salaries and commissions, CRM software, sales tools, promotions, discounts and proportional overhead may all contribute to acquisition. Separate direct costs from shared expenses, then use the same allocation method each time. If a sales team supports several products, assigning its full cost to one product misrepresents the resources used to attract customers.
Attribution is harder when customers interact with several channels before purchasing. A prospect might discover a company through content, return through paid search and convert after speaking with sales. Crediting only the final touchpoint can understate earlier contributions. Customer Journey Mapping helps organise those interactions, but teams still need a consistent attribution rule when comparing channels or evaluating conversion and revenue.
Timing can also skew results. Campaign costs may occur in one month while leads become customers later, particularly with longer sales cycles. Comparing this month’s spending with customers acquired before the campaign matured can make CAC appear unusually high. Growing businesses should keep reporting periods consistent and interpret short-term changes alongside the path from first interaction to purchase.
Use a repeatable calculation process to make these choices visible:
- Set the reporting period and define when a new customer qualifies.
- List direct marketing and sales expenses, including salaries and commissions.
- Allocate shared software, tools and overhead using a consistent method.
- Connect new customers to acquisition activity using a stated attribution approach.
- Compare the result with the same period’s customer count and review unusual changes.
These steps won’t resolve every attribution question, but they make assumptions easier to spot. Record what the calculation includes, which customer event counts and how shared costs are assigned. Then a change in CAC can signal a real shift in acquisition performance rather than a quiet change in accounting method.
Customer acquisition and business growth
Customer acquisition can support growth when it contributes to sustainable business value. A rising customer count alone doesn’t show whether the business is building profit. Compare acquisition spending with customer value, conversion quality and the resources needed to serve each new account. This makes growth a decision about sustainable demand, not just volume.
Start with the funnel. Track how prospects move from awareness to qualified leads, purchases and retained customers. If many leads produce few purchases, sales and marketing may be attracting the wrong audience or losing prospects between stages. Align lead definitions and qualification criteria to identify where conversion slows, then focus improvements on that stage.
Payback gives another view of growth efficiency. For example, a customer with a $200 CAC and $50 in monthly profit has a four-month payback period. That means the business needs to account for the time between acquisition spending and recovering that cost through profit. Compare payback with customer retention and lifetime value before increasing acquisition investment.
Retention can change the economics of growth. Acquiring a new customer costs businesses 4-5 times as much as retaining an existing customer. A strategy that supports repeat purchases can therefore strengthen the value generated from earlier acquisition spending. Referrals can also extend reach: referred customers often have a higher likelihood of converting and a lower acquisition cost than customers from traditional marketing channels.
Growth doesn’t require every channel to deliver immediate profit on its own. These figures describe different measures, so treat them as context rather than a direct comparison. Assess the role each channel plays in generating qualified demand and contributing to later purchases.
Use a practical review to connect acquisition with business outcomes:
- Compare channel spend with qualified leads, purchases and retained customers.
- Find the funnel stage where prospects stop progressing.
- Review customer value and payback before increasing spend.
- Include retention and referral activity in the growth picture.
Operational details can affect conversion too. Google reports that a one-second delay can lower conversions by up to 20%. This makes the customer experience part of acquisition efficiency, not a separate concern. Review friction across key purchase steps alongside channel results, then prioritise changes that help the intended audience complete those steps.
The takeaway: scale what brings in customers who stay and contribute value. A lower CAC matters most when it supports profit, while a higher acquisition cost may make sense when customer value and retention justify it. Keep sales and marketing aligned around funnel quality, not lead volume alone, and assess growth through both new demand and lasting customer relationships.
How does CAC vary by industry, business model, and customer lifetime value?
CAC has no universal target because businesses acquire different customers through different sales models. A SaaS subscription, an enterprise contract and an online retail purchase each have different revenue and retention patterns. Compare companies with similar business models, deal sizes and customer economics. A channel figure is more useful when its context matches your own.
For SaaS, reported 2025 ranges vary by company stage. Larger operations and longer buying journeys can shape how those costs accumulate.
Deal value also changes the acquisition equation in B2B. Compare acquisition cost with expected customer value, rather than judging it alone.
E-commerce benchmarks connect CAC with average order value. Purchase size provides context, but repeat buying and retention also affect the value generated over time.
These ranges are reference points, not interchangeable targets. A high-value B2B contract can support a different acquisition investment from a lower-priced retail order. A subscription business also depends on customers remaining long enough to generate value. Longer customer relationships can help spread acquisition costs over time. Include customer lifetime value when assessing whether a channel’s cost fits your business model.
Use the comparisons to ask more useful questions:
- Does the benchmark match your industry, deal size and business stage?
- Does customer lifetime value justify the cost of acquiring that customer?
- Do repeat purchases or retention change the economics over time?
- Does each channel bring customers who fit your intended audience?
For a channel-level comparison, group results by customer type and business model before reallocating spend. Customer Journey Mapping can show how different touchpoints contribute to a conversion, rather than crediting only the final interaction. That context makes CAC a stronger input for growth decisions.
Explore customer journey mapping
Nodal AI: Nodal Platform
Nodal AI’s Nodal Platform helps businesses turn fragmented data into actionable insights. When channel results sit across separate systems, Performance Marketing Analytics can bring performance into a clearer view. Automated Reporting reduces the need to assemble recurring reports manually, while Growth Recommendations help identify potential next steps from the data.
Consider the platform when channel comparisons are difficult to interpret or customer journeys span multiple touchpoints. Connecting those signals can help teams spot patterns, assess acquisition performance and make more informed growth decisions. The platform supports analysis and recommendations, rather than managing media buying or producing creative content.
Contact Nodal AI about the Nodal Platform
Turn channel insight into your next growth decision
Make your next budget review a decision point, not just a reporting exercise. Use customer acquisition cost by channel to test whether your assumptions about audience, journey and customer value still hold. Then identify what you’ll learn from the next investment, such as which touchpoints support progression or where prospects disengage.
That learning loop can help teams respond with greater focus. Nodal AI’s Nodal Platform brings together Performance Marketing Analytics and Growth Recommendations to support clearer decisions from marketing data. The aim is to move from fragmented results to an informed next step, with business priorities at the centre.
Choose one question your next review should answer, and let it guide what you measure and change. Consistent learning helps your growth strategy adapt as customer behaviour and channel performance shift.
Take the next step with a clearer view of what drives progress.
Frequently Asked Questions
What Costs are Included in CAC?
Include expenses that support attracting, converting and onboarding new customers. A practical review can include campaign spend, sales salaries and commissions, CRM access, sales tools, discounts, promotions and the relevant share of overhead. For a campaign supported by a shared sales team, allocate only the portion connected to acquisition. Keep the cost boundary consistent across reporting periods, so changes reflect performance rather than a different expense list.
What Is CAC and Why Does It Matter Right Now?
CAC is the cost of gaining a new customer, and it matters whenever a business reviews growth investment. Track it alongside changes in audience response, conversion and customer value. If costs rise while the customer mix or conversion quality shifts, the headline figure alone won’t explain why. Regular reviews help teams spot changes early and adjust targeting, channel mix or the path from initial interest to purchase.
Why is CAC important for businesses?
CAC helps businesses judge whether acquisition activity supports profitable growth. A high-volume campaign might bring in customers who rarely return, while a smaller source attracts stronger repeat demand. Use the measure to guide decisions about audience selection, sales capacity and investment priorities. It also gives finance, sales and marketing teams a shared way to discuss acquisition efficiency, rather than relying on clicks or lead counts alone.
What is customer acquisition cost (CAC), and how is it calculated by marketing channel?
CAC is the acquisition expense divided by the new customers gained during the chosen period. To compare channels, assign each customer to a consistent source or attribution method, then match relevant expenses to that source. Include campaign costs and any allocated sales or shared operating expenses. If a customer engages with several channels, use the same attribution approach for each one to keep the comparison consistent.
What is the average customer acquisition cost by channel in the United States?
There isn’t one useful average for every US business, because channel costs depend on the customer, business model and calculation method. A B2B contract with a long sales process cannot be directly compared with a single online retail purchase. To make an average meaningful, segment results by business type, customer definition and channel, then compare similar periods using the same cost inclusions.
What are typical CAC benchmarks for paid search, paid social, SEO, email, and referrals?
Benchmarks vary by market, audience and business model, so treat them as comparison points rather than targets. Paid search and paid social costs reflect campaign spend and conversion performance; SEO also involves ongoing content and optimisation work. Email and referral activity may draw on existing relationships, but still require appropriate cost allocation. Compare like with like, and consider the learning period when interpreting newer campaigns.
How should businesses attribute customer acquisition costs across multiple channels?
Choose an attribution approach that matches how customers discover and evaluate your business. First-touch attribution credits the initial interaction, last-touch credits the final one, and multi-touch methods distribute credit across several interactions. For example, a prospect may arrive through organic search, return via email and convert after a sales conversation. Record interactions consistently, then explain how credit and shared costs are assigned.
How can businesses compare CAC with customer lifetime value and payback period?
Compare CAC with the profit a customer is expected to generate over the relationship, not revenue alone. Estimate payback by dividing acquisition cost by the customer’s contribution profit over a consistent period. This shows how long recovery may take and whether the relationship can support the upfront investment. Review retention, repeat purchases and service costs too, since each can change the value left after acquisition.


