

A platform CAC can look efficient even when the full cost of acquisition tells a different story. Blended CAC divides total marketing and sales expenses by the number of new customers acquired in the same period. Effective blended CAC optimisation starts with a consistent view of the costs included.
It’s easy to mistake channel or platform CAC for the whole picture: each shows the apparent cost of a particular source. Blended CAC gives you a business-wide view, while the blended CAC ratio compares sales and marketing expenses with new contracted recurring revenue. This article explains which costs to include, how blended CAC compares with channel and platform figures, and what the ratio can reveal about acquisition efficiency. You’ll also learn why a clear, consistent method makes these figures more useful for marketing and growth decisions.
Key Takeaways
- Blended CAC shows the overall cost of acquiring customers by comparing total marketing and sales expenses with new customers acquired in the same period.
- Include acquisition-related costs consistently, such as media, creative, agency support and relevant team expenses.
- Use channel and platform CAC to understand individual sources, then compare them with the business-wide view to spot gaps in attribution.
- The blended CAC ratio connects fully loaded sales and marketing expenses with new and expansion contracted recurring revenue.
- Track the measures together to see whether acquisition efficiency is changing and where closer performance analysis could help.
Acquisition costs included in the numerator
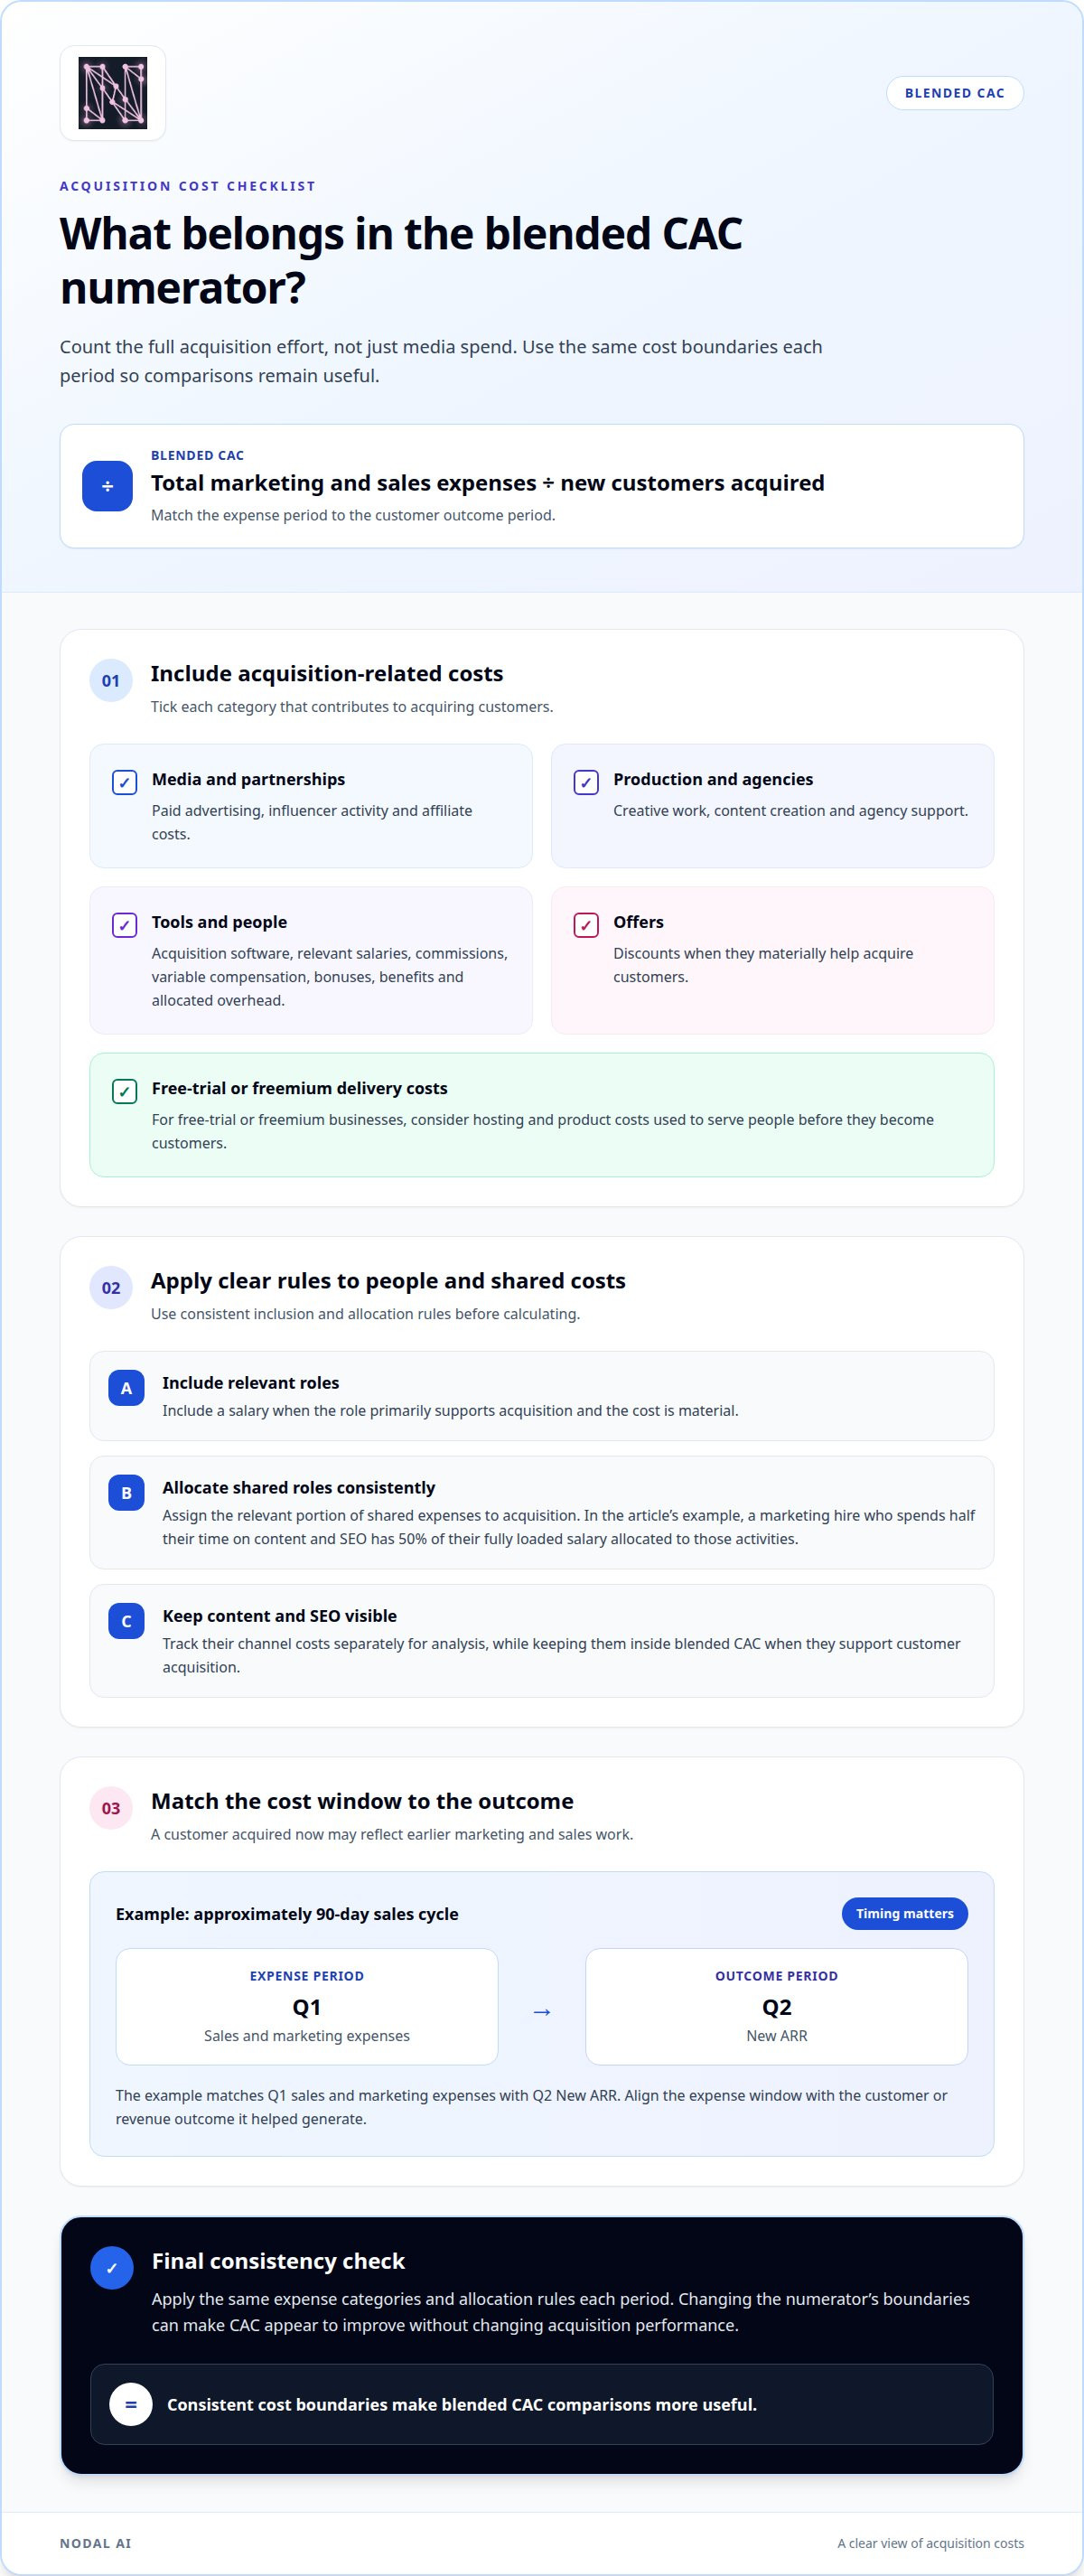
Blended CAC divides total marketing and sales expenses by the number of new customers acquired in the same period. The numerator should reflect the full acquisition effort, not just media spend. Include media, creative, influencer, affiliate, agency and acquisition-tooling costs. The calculation is useful for decision-making only when you apply the same expense categories over time.
Separate spending into clear categories before calculating. This breakdown shows how non-media work contributes to acquisition. For a fully loaded measure, include sales costs such as variable compensation, bonuses, benefits and shared expenses allocated to sales and marketing.
- Media and partnerships: Paid advertising, influencer activity and affiliate costs.
- Production and agencies: Creative work, content creation and agency support.
- Tools and people: Acquisition software, relevant salaries, commissions, benefits and allocated overhead.
- Offers: Discounts when they materially help acquire customers.
Apply the same inclusion rules each period. Include a salary when the role primarily supports acquisition and the cost is material. For shared roles, allocate the relevant portion consistently. If a marketing hire spends half their time on content and SEO, the example allocates 50% of their fully loaded salary to those activities. Consistency makes comparisons useful; changing the numerator’s boundaries can make CAC appear to improve without changing acquisition performance.
Content and organic acquisition need their own cost view too. The example pairs this with a $7,200 lifetime value, producing an LTV/CAC ratio of 45:1. Review content and SEO channel CAC monthly or quarterly, while keeping those costs inside blended CAC when they support customer acquisition.
For freemium or free-trial businesses, acquisition costs may also include delivery costs, such as hosting and product costs. This captures resources used to serve people who enter through a free offer before becoming customers. A longer sales cycle also shifts the timing: for an approximately 90-day cycle, the example compares Q1 sales and marketing expenses with Q2 New ARR. Match the expense window to the customer or revenue outcome it helped generate.
For investors, present the metric with its period and cost boundaries. One illustrative presentation shows a six-month blended CAC of around $200 and an LTV/CAC ratio of 36:1, then proposes increasing content and SEO investment over the next 12 months with projected blended CAC below $180. That projection is useful only when assumptions and included costs remain visible. Clear boundaries turn blended CAC optimisation into a more credible basis for investment decisions.
Channel-specific CAC calculation and attribution
Blended CAC shows the overall acquisition cost, while channel CAC helps explain which sources contribute to it. Use both measures to guide spending decisions, rather than treating platform reports as the complete picture.
Formula and Calculation Window
Calculate blended CAC by dividing total marketing and sales expenses by the number of new customers acquired in the matching period. The time window matters: a customer acquired today may be the result of earlier marketing or sales efforts.
For short cycles, align expenses and outcomes closely. For an approximately 30-day sales cycle, the example compares the previous month’s Sales and Marketing expenses with the current month’s New ARR. The standard also uses rolling periods of 1, 3, 6 or 12 months for the Blended CAC Ratio. Match the window to the buying journey, then use it consistently.
Channel Costs and Attribution
Channel CAC divides the costs assigned to a source by the new customers attributed to it. Group paid, organic, sales and referral activity consistently, and separate direct costs from shared costs before comparing channels.
Attribution models can credit different touchpoints, so a last-click report may undercount earlier organic or referral influence. Tracking gaps, duplicate conversions and inconsistent customer definitions can also distort results. Use the same attribution approach for comparisons, then reconcile channel totals with business-wide spending and customer counts. This helps avoid shifting budget based on incomplete platform data.
To reduce CAC without sacrificing growth or customer quality, assess channel performance alongside customer value, retention and segment fit. Direct spending towards channels that bring valuable customers, then use controlled budget experiments to test whether additional investment brings in more customers or simply takes credit for existing demand.
Worked Calculation Examples
A SaaS startup spends $20,000 in one month and acquires 100 new customers. Its blended CAC is $200 per customer. This business-wide measure includes acquisition across channels, rather than assigning every customer to a single source.
For a 30-day sales cycle, the example uses $500,000 in Sales and Marketing expenses, $380,000 in New CARR and $100,000 in Expansion CARR for the last 30 days. The timing links the spend with the revenue period it helped generate.
Use blended CAC as the business-level measure and channel CAC for tactical decisions. For example, review paid search weekly for fast feedback, while monthly reporting supports broader planning. Compare channel changes with the overall metric, not in isolation.
Benchmarks and Target Setting
There’s no universal blended CAC benchmark across industries or business models. Set a target using customer lifetime value, gross margin and the payback period your business can support; a commonly cited sustainable LTV-to-CAC target is at least 3:1.
Gross margin affects how much revenue remains to recover acquisition costs, while payback affects how quickly that cost returns. A 3:1 to 5:1 LTV-to-CAC ratio is presented as an ideal range, but cash constraints and margin shape the practical target. Avoid cuts that lower CAC while weakening customer quality or future value.
Base marketing decisions on both views: use channel CAC to guide tactical allocation and blended CAC to judge the combined result. Common mistakes include changing cost boundaries, mismatching periods and relying on attribution that overcredits one channel. Keep customer definitions stable, and test budget changes against incremental acquisition and retention.
Comparing blended and channel-specific CAC
Blended CAC summarises acquisition efficiency across the business; channel CAC shows the cost attributed to an individual source. Compare both to understand overall performance and make more informed decisions about advertising, traffic and conversion.
Blended and Channel-Level Views
Channel CAC divides the costs assigned to a channel by the customers attributed to it. It can reveal differences between sources, but attribution rules influence which channel receives credit.
Read that figure alongside blended CAC: the channel view guides tactical adjustments, while the blended view shows whether the overall acquisition mix is becoming more efficient.
Cohort analysis adds another perspective by comparing groups of customers acquired in different periods or through different channels. Incrementality testing, through geo holdouts, creative holdouts or controlled budget experiments, helps show whether advertising generated additional conversions rather than claiming credit for traffic that would have converted anyway.
Channel Dependence and Analysis Timing
Channel analysis tracks acquisition costs and customers by source, then compares performance over time. It matters because a strong overall result can hide dependence on one channel or increased spending on a weaker source.
Review channel trends alongside the blended result. A startup spending around $10,000 to $15,000 per month on marketing may use that level as a trigger to begin channel analysis; consistently spending over $20,000 per month makes it a priority in the example. These are reference points, not universal thresholds.
Allocate shared costs consistently. If a marketing hire spends 50% of their time on content and SEO, allocate 50% of their fully loaded salary to those activities. Apply the same logic to shared software and other tools, so channel comparisons reflect effort without counting costs twice.
To reduce reliance on one platform, measure the contribution of other sources, including organic, referral and sales activity. Compare customer acquisition and conversion trends by channel, then test budget changes. A lower channel CAC alone doesn’t prove that shifting more spend will bring in more customers.
Use a dashboard that brings together spending, attributed customers, conversions and blended CAC for the same reporting period. Marketing platforms report their own results; a consolidated view helps compare those claims with business-wide customer records. Keep attribution rules and customer definitions stable, and note changes that may affect the trend.
Review high-spend, fast-feedback channels such as paid search weekly, then use monthly reporting for broader planning. If channel CAC falls while blended CAC rises, investigate spending outside that channel, shared-cost allocations and customer counts. This makes channel comparisons a practical input to budget decisions, rather than a contest between platform metrics.
Blended CAC Ratio definition and purpose
The Blended CAC Ratio measures fully loaded Sales and Marketing expenses against each dollar of new Contracted Annual Recurring Revenue (CARR). It combines New Customer CARR with Expansion CARR from existing customers, linking acquisition spending to the recurring revenue generated.
This ratio answers a different question from customer acquisition cost. That distinction helps subscription businesses assess whether acquisition and expansion spending is translating into revenue, rather than focusing only on customer numbers.
Use the sales cycle to match the expense period with the revenue outcome. For an approximately 90-day sales cycle, the example uses Sales and Marketing expenses from 91-180 days ago against New CARR and Expansion CARR from the last 90 days. It records $600,000 in New CARR and $200,000 in Expansion CARR. Aligning these periods reflects the time between spending and the resulting contracts.
Keep the revenue components distinct. New CARR represents newly contracted recurring revenue, while Expansion CARR comes from existing customers increasing their commitments. Neither measure is the same as Net New ARR: Net New ARR equals current-period CARR minus previous-period CARR. New CARR and Expansion CARR exclude churn and down-sells, so combining them with Net New ARR changes what the ratio represents.
Fully load the expense side before comparing periods. Include sales commissions upfront, along with variable compensation, bonuses, benefits and shared costs allocated to Sales and Marketing. If Customer Success time supports upselling or cross-selling, allocate the relevant expense according to the time spent on those activities. This keeps the ratio connected to the work that generated new or expanded contracts.
Read the result alongside customer acquisition cost, conversion rate, campaigns and retention. A stronger conversion rate may generate more customers from existing spending, while retention affects the value of acquired customers over time. The ratio alone cannot identify which campaign or channel caused a change, so use it with channel reporting and customer data before adjusting spending.
For example, if the ratio rises, investigate whether Sales and Marketing expenses increased, CARR weakened or the measurement windows no longer match the sales cycle. If it falls, check whether new revenue improved or costs were excluded inconsistently. Stable definitions make the ratio useful for comparing performance and informing acquisition decisions, rather than a figure that shifts with accounting choices.
Revenue generation is the relevant outcome. Businesses can use blended CAC alongside customer lifetime value and customer churn rate to assess the effectiveness of customer acquisition campaigns.
Blended CAC compared with platform CAC
Platform CAC shows the acquisition cost reported by an advertising platform; blended CAC compares total marketing and sales spending with new customers acquired. The difference matters: platform figures help assess campaign performance, while the blended view includes costs and customer activity beyond a platform’s tracking.
Google Ads, Facebook Ads and LinkedIn Ads can each report conversions linked to their campaigns. But when a customer sees several ads before buying, more than one platform may claim the conversion. Adding platform-reported customers can therefore count the same person more than once. The blended calculation uses the business’s customer count, not the sum of platform conversion claims.
Platform CAC can also omit costs that don’t appear in an ad account. A Google campaign may show media spend and attributed conversions, while the broader acquisition effort also includes agency fees, creative, tooling and relevant salaries. Blended CAC captures these expenses in the overall numerator. Use the platform measure for campaign decisions, then use the blended result to assess total acquisition efficiency.
Treat platform click costs as context, not customer costs. A click isn’t a customer. Conversion rate, subsequent interactions and costs beyond media determine how click spending translates into customer acquisition cost.
- Use platform CAC to compare campaigns within that platform and manage tactical spending.
- Use blended CAC to assess acquisition across channels, including marketing and sales expenses.
- Reconcile the measures by aligning periods, customer definitions and attribution rules.
For example, if Google reports lower CAC while blended CAC rises, don’t assume Google became less profitable. Check whether other channels became more expensive, customer volumes changed or tracking credited the same conversion across platforms. If blended CAC falls while platform CAC stays steady, improvements may come from organic acquisition, referrals or costs beyond paid media.
Use both readings together. Platform dashboards show reported campaign outcomes; business-level tracking checks whether those outcomes align with actual new customers and total spending. Stable definitions make changes easier to interpret. Without reconciliation, budget shifts based on platform CAC alone may reward duplicated credit or overlook acquisition costs beyond advertising.
Connect channel and platform performance with consolidated marketing analytics and customer journey data, so platform claims can be compared with business outcomes.
Explore performance analytics features
Nodal AI
Nodal AI helps businesses make sense of fragmented acquisition data through the Nodal Platform and Performance Marketing Analytics. Turn to it when platform CAC and blended results are difficult to reconcile, or when reporting doesn’t give your team a clear basis for decisions.
Automated Reporting brings performance information together, while Growth Recommendations help identify areas to investigate. Together, they support a clearer view of how channel activity relates to overall acquisition performance, without mistaking platform-reported conversions for the complete business picture.
Contact Nodal AI to discuss how the analytics platform can support your acquisition measurement.
Turn measurement into your next decision
Make your next acquisition decision a test, not an assumption. Choose a change that addresses a clear uncertainty, define what success means for your business, and observe how customer quality and overall performance respond. This makes blended CAC optimisation an ongoing decision-making practice, not a one-off effort to lower a figure.
Keep the learning visible across teams. Record why you made a change, what shifted in the customer journey and whether the outcome supports your next move. That context helps prevent short-term fluctuations from driving decisions that weaken durable growth.
Bring your acquisition measurement challenges to Nodal AI and explore how a clearer view can support your next decision.
Start with one focused question. Each clear answer gives your team a stronger foundation for the next step.
Frequently Asked Questions
What Is Blended CAC?
Blended CAC is the average acquisition spend associated with each new customer across the business’s marketing and sales activity. It gives leaders a business-wide efficiency measure, not a verdict on one campaign. Use it to assess the overall direction, then examine customer segments and retention to understand whether lower acquisition costs also bring in customers who stay and contribute value.
What is blended CAC and how is it calculated?
Calculate blended CAC by dividing eligible marketing and sales expenses by the number of new customers acquired in the chosen period. First, define “new customer” consistently, such as a first-time purchaser or a new subscriber, then match the expense window to the acquisition outcome. If the sales cycle spans periods, align costs with the customers or revenue they helped generate rather than assuming that every conversion resulted from spending in the same period.
How does blended CAC differ from paid CAC and customer acquisition cost by channel?
Paid CAC isolates customers credited to paid advertising, while channel CAC measures a defined source, such as organic search, referrals or sales. Blended CAC combines acquisition across the business, including relevant costs beyond ad spend. For example, if a platform reports conversions but customer records show fewer unique new buyers, use the business-wide count for the blended measure and investigate the attribution gap before changing campaign budgets.


