

Yes, you can automate client marketing reports by connecting data sources to dashboards and scheduling delivery. The best marketing reporting tools for agencies in the UK depend on your channels, the customisation clients need and whether you require white-label dashboards. Automation cuts repetitive work, but the setup still needs to make performance clear.
It’s easy to see why agencies want reporting to take less time. Manually combining data leaves less time to interpret results and explain them to clients. A useful tool should do more than collect metrics: it should turn campaign activity into a clear view of performance.
This guide compares six reporting options by data connections, automation, dashboard flexibility and white-label features. You’ll learn how to assess reporting workflows, weigh trade-offs and choose an approach that fits your agency. The aim is simple: spend less time assembling reports and gain more clarity about what the numbers show.
Key Takeaways
- Separate client-facing reports from internal KPI dashboards so each audience gets the view it needs.
- Automate data imports from marketing platforms to reduce manual report preparation and keep information together.
- Compare reporting options by integrations, scheduling, white-label controls and dashboard flexibility.
- Use interactive dashboards to make performance patterns easier to explore and explain.
- Choose a tool around your agency’s workflows, client needs and reporting priorities, not feature lists alone.
How does white-label client reporting work?
White-label reporting presents clients with agency-branded dashboards and reports. Before building the workflow, define the audience, data view and delivery schedule.
Client Reports and Internal KPI Dashboards
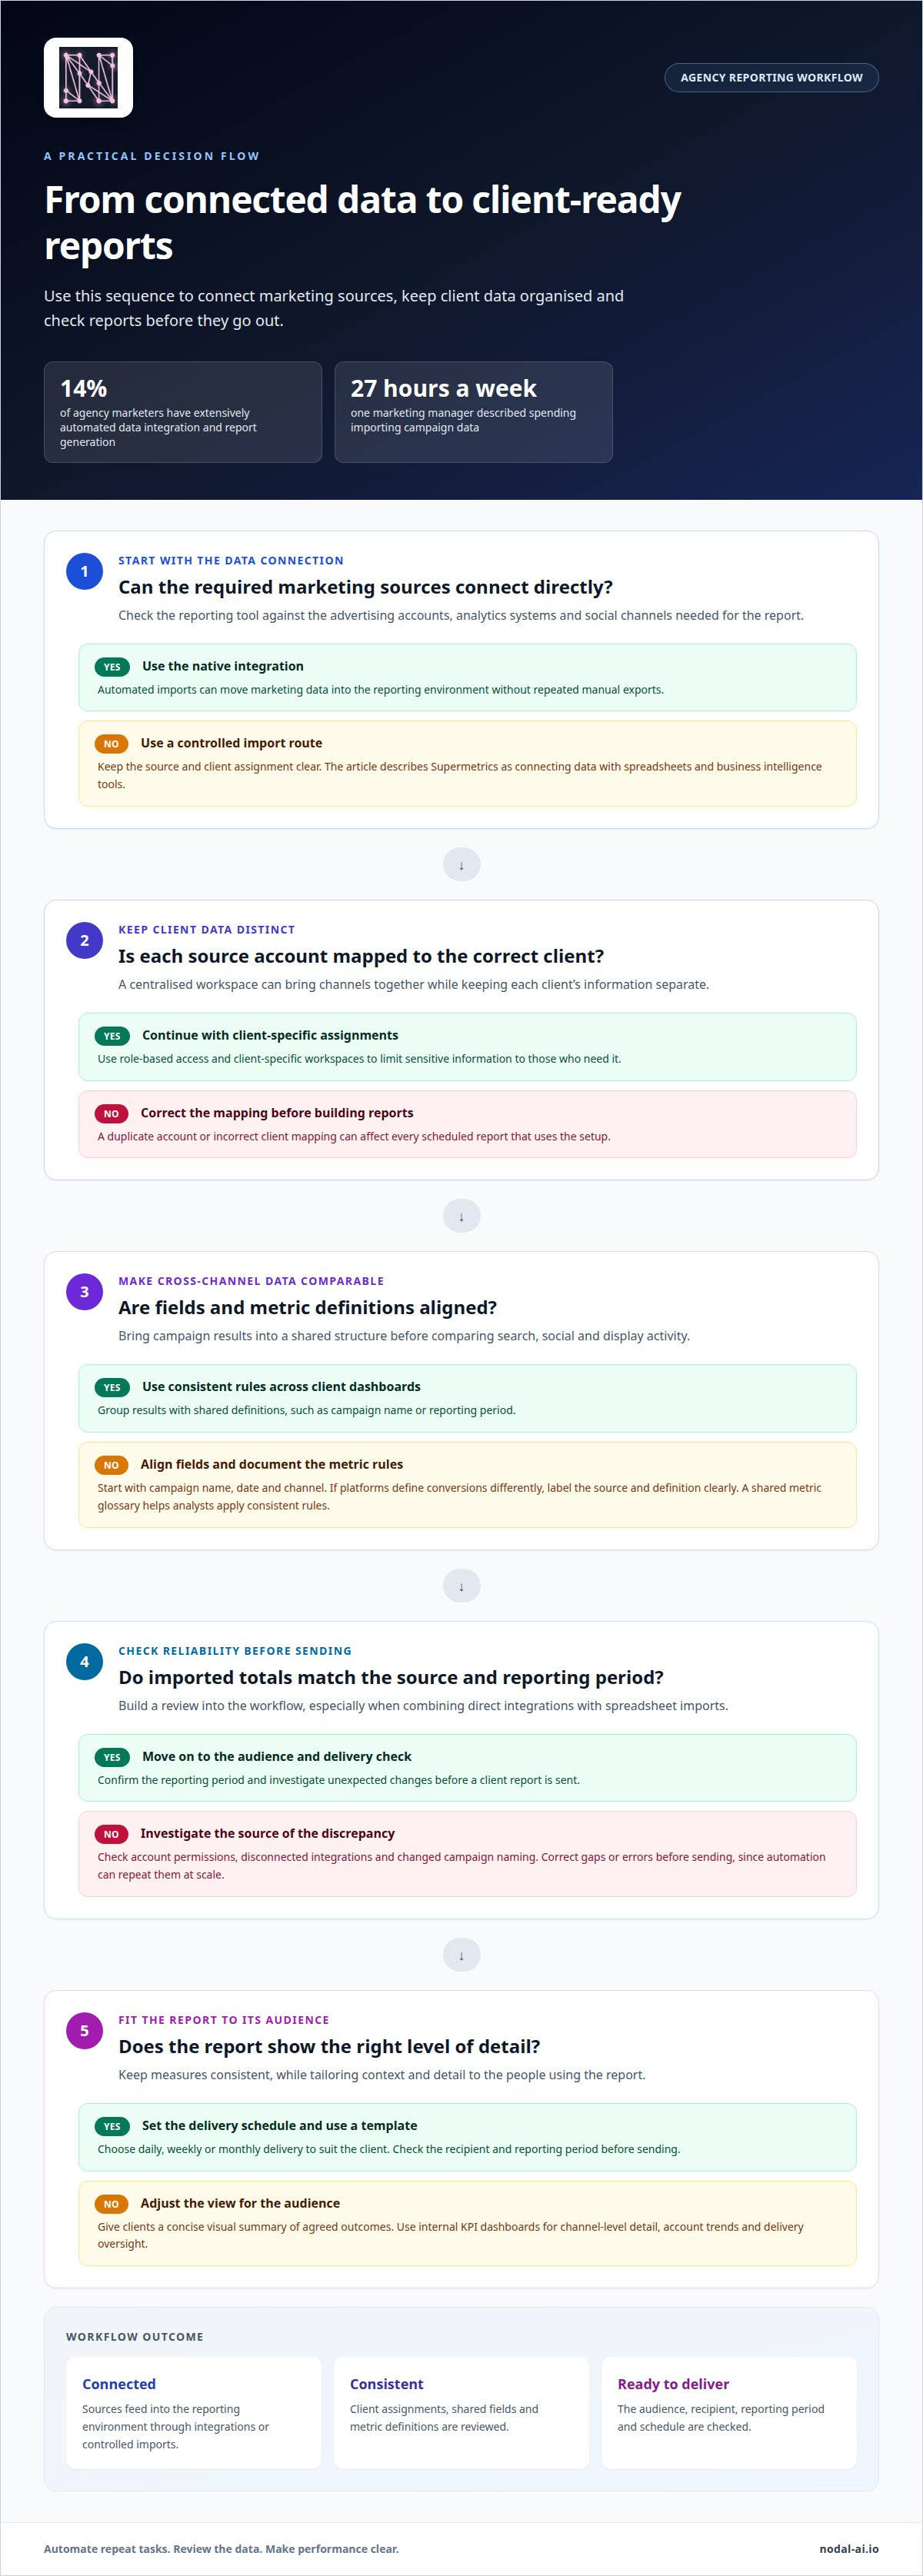
Client reports focus on agreed outcomes, such as performance across channels. Internal KPI dashboards help agency teams manage delivery and spot issues. For example, give clients a concise visual summary, then use an internal dashboard to examine channel-level detail and account trends. Keep measures consistent while tailoring the context and level of detail to each audience.
Centralised Marketing Data Across Clients
A centralised reporting workspace brings marketing data from different channels into one view, while keeping each client’s information distinct. Map source accounts to the right client, then group results using shared definitions, such as campaign name or reporting period. A scalable dashboard example can cover an agency managing 100 clients. Centralisation simplifies comparison, but access boundaries still matter.
Branded Dashboards and Client Portals
White-label dashboards replace the reporting interface’s external branding with the agency’s identity, giving clients a consistent experience. A branded client portal can present reports, visual charts and campaign context in one place, rather than sending separate files. In 2026, full white-labelling is an expected feature of agency reporting platforms. Compare branding controls alongside the practical need for a clear, client-ready view.
Automated Reports and Scheduled Delivery
Automated reporting schedules prepared reports, reducing repeated manual exports. Set daily, weekly or monthly delivery to suit each client’s needs, and use templates for consistency. A weekly campaign summary might highlight channel results, while a monthly report can show longer-term trends. Check the recipient and reporting period before sending.
For UK agencies, UK GDPR governs the processing of personal data, according to the Information Commissioner’s Office. Use role-based access and client-specific workspaces to limit sensitive information to those who need it. Prefer native integrations when they cover the necessary sources, and use controlled imports for channels that require another connection method.
| Option | Audience | Branding | Best fit |
|---|---|---|---|
| Internal KPI dashboard | Agency team | Internal | Account and delivery oversight |
| Client report | Client stakeholders | Agency-branded | Focused performance updates |
| Centralised workspace | Agency team | Internal | Multi-channel and multi-client data |
| White-label portal | Clients | Agency-branded | Ongoing self-serve reporting |
Choose the format for the audience, then match its data detail, branding and delivery schedule to the reporting task.
Can I automate marketing reports for clients?
Yes. Connect marketing platforms to reporting tools, organise imported data, then generate reports on a schedule. The main risks are incomplete imports, inconsistent metric definitions and errors that automation repeats. Only 14% of agency marketers have extensively automated data integration and report generation, so a clear workflow matters.
Platform Integrations and Automated Imports
Direct integrations connect reporting platforms with sources such as advertising accounts, analytics systems and social channels. They can transfer marketing data automatically, rather than requiring an analyst to export files for each report. Supermetrics connects data with spreadsheets and business intelligence tools, providing a route from source platforms to a chosen reporting environment.
Funnel focuses on collecting marketing data and transforming it into a more consistent structure for analysis. In either approach, map each source account to the correct client before building reports. A marketing manager described spending 27 hours per week importing campaign data. Automating repeat imports can reduce that manual step, while leaving time for analysis and explanation.
Cross-Channel Data and Custom Metrics
Cross-channel reporting brings campaign results into a shared structure, so clients can review search, social and display activity together. Start by aligning fields such as campaign name, date and channel. Then define metrics that answer a business question, such as comparing channel costs with recorded conversions, rather than placing unrelated platform totals side by side.
Make calculations transparent. If platforms define conversions differently, label the source and definition clearly. A shared metric glossary helps analysts apply consistent rules across client dashboards. It also gives each report context, so visual summaries lead to useful insights without implying that every channel measures performance in the same way.
Data Reliability and Automation Risks
Automation relies on working connections and consistent source data. Changed account permissions, disconnected integrations or altered campaign naming can interrupt imports or create gaps. Build a review into the process: compare imported totals with the source platform, confirm the reporting period and investigate unexpected changes before sending a client report.
Automation can also repeat errors at scale. A mistaken metric, duplicate account or incorrect client mapping can affect every scheduled report that uses the setup. Separate access and client assignments, document metric definitions, and review new templates before wider use. These controls are particularly important when combining channels or using spreadsheet imports alongside direct integrations.
Choose integrations for the sources you actually use, then test a complete reporting cycle before relying on automation. That means checking imported marketing data, cross-channel metrics and final client outputs together.
Marketing reporting software comparison for UK agencies
Compare reporting tools by data sources, account connections, refresh controls and output options. For SEO, paid media and cross-channel reporting, match the tool to your channel coverage and metric needs. Treat GBP display, VAT invoicing and UK data hosting as separate requirements.
Marketing Reporting Platforms
A marketing reporting platform brings channel data into client-ready reports, often with templates and account-level organisation. Compare its supported sources, import methods and outputs. A team working with Google Ads and organic search may prioritise those connections, while an agency combining several channels needs consistent naming and metric definitions.
Use this comparison to narrow the options by purpose, not by feature-list length:
| Option | Useful for | Compare |
|---|---|---|
| Marketing reporting platform | Recurring client reports | Sources, templates, scheduling |
| Google Sheets workflow | Flexible tabular analysis | Imports, formulas, upkeep |
| BI software such as Studio | Custom visual analysis | Data preparation, sharing |
Reporting Tools and BI Software
A dedicated reporting tool focuses on marketing accounts and repeatable client reports. Business intelligence software usually offers broader ways to model, combine and visualise data. Sheets can bridge the two when analysts need editable tables or custom calculations, but the workflow depends on maintaining imports and formulas.
Choose a reporting tool for standardised delivery across accounts. Choose BI software when analysis requires data beyond marketing sources or bespoke modelling. If your team uses Sheets, assign responsibility for calculations and updates so client figures don’t rely on undocumented edits.
Agency Reporting Software
Agency reporting software is designed for multiple client accounts, reusable templates and permissions. Compare how clearly it separates accounts, supports your teams’ channels and presents reports to clients. A dashboard that suits one brand may require more administration when adapted for different clients.
Review the full reporting path: source connection, data transformation, visual output and export or sharing method. For UK operations, distinguish GBP display from VAT invoice handling and hosting location. Currency presentation alone does not establish how invoices are treated or where data is hosted.
SEO, Paid Media, and Cross-Channel Performance
SEO reporting needs search visibility and website performance data; paid media reporting needs campaign-level account data, such as Google Ads results. A cross-channel platform should bring these sources into a shared view while keeping metric definitions clear. The right fit depends on whether your agency needs in-depth channel analysis or a combined view.
Before choosing, map each reporting question to its source and output: organic trends, paid campaign performance or combined channel contribution. Then compare connector coverage, account handling and export options, including Sheets or Studio workflows where relevant. This keeps the comparison focused on useful analysis rather than features your agency won’t use.
Custom dashboards and interactive visualisations
A custom dashboard turns campaign analytics into a visual workspace for a client or team. Organise metrics around decisions, then choose whether users need an interactive view, a monthly summary or both.
Dashboard and BI Tools
A dashboard presents selected metrics in charts, tables and summary cards. Business intelligence tools offer additional ways to combine data and explore relationships across sources. For example, Looker Studio can display marketing measures in a shared visual report, while a spreadsheet can support calculations before they appear on the dashboard.
Build the view around a reporting question. For a paid campaign, show spend, conversions and cost per conversion together; for SEO, focus on search visibility and website activity. Each chart then has a clear purpose, helping clients move from the headline result to the detail behind it.
Dashboard Branding and Customisation
Customisation affects layout, labels, colours and level of detail. Branding can align client-facing reports with the agency’s identity, while internal analytics may need denser tables and operational measures. Use a consistent template for recurring reports, then adapt charts and descriptions to each client’s goals.
Keep the visual hierarchy clear: show the primary outcome first, supporting metrics next and diagnostic detail below. In Looker Studio, for example, a summary can lead into channel charts and a campaign-results table. Clear labels matter, especially when clients use different definitions for similar measures.
Interactive features let users filter or explore results without requesting a revised report. A client reviewing a monthly dashboard might narrow the view to a campaign or date range, while an account manager uses the same data to inspect channel performance. Add filters only when they answer a real question; unnecessary controls make results harder to interpret.
Alerts can flag changes for review, while dashboards provide the context. For example, an alert could highlight a change in a selected campaign metric, then the team can use the dashboard to compare channels and time periods. Set conditions around meaningful measures, and clarify who reviews each alert and what happens next.
Email reports suit clients who want a concise update without opening a dashboard. A scheduled monthly email can highlight key outcomes and direct readers to a fuller visual report. Dashboards work better for exploration; email works better for a consistent snapshot. Use both when stakeholders need a brief update and analysts need access to detail.
Before publishing, follow three steps: define each metric, check that charts use the intended date range, and test filters in a sample client view. This keeps the dashboard’s visual story aligned with its underlying analytics.
Selecting reporting tools based on business needs
Choose a reporting tool by starting with the decisions your agency and clients need to make. A platform built for Google Ads summaries may not suit cross-channel analysis, while a warehouse-centred workflow can be excessive for straightforward client reports. Match the tool to your data, team skills and preferred report format.
Use this decision sequence to turn your requirements into a shortlist:
- Define the reporting job. Separate client reporting from internal tracking. For example, a client may need campaign outcomes, while an account team needs detailed channel and account views.
- Map the data sources. List the platforms each report needs, such as Google Ads, analytics and search data. Confirm the reporting tool connects to those sources directly or supports a workable import route.
- Set the analysis depth. A template-based report can suit recurring channel updates. A team combining marketing data with sales or customer records may need a warehouse and broader analysis tools.
- Choose the delivery format. Decide whether stakeholders need an interactive dashboard, a scheduled email report, an export or a combination. A client who reviews results in meetings may value a concise visual summary and supporting detail.
- Plan ownership. Identify who maintains account connections, metric definitions and report templates. A tool that depends on specialist edits for every client may slow an agency’s reporting process.
Then compare each shortlisted option against the same real workflow. For a paid media account, trace Google Ads data from connection through metric calculation to the final client report. For cross-channel tracking, test whether naming conventions and date ranges stay consistent when sources are combined. This reveals practical gaps that feature lists can hide.
Consider complexity in terms of staff time and maintenance, rather than assuming more integrations mean a better fit. A warehouse can support broader data modelling, but it also adds a layer that needs managing. If your agency mainly needs repeatable marketing reports, a focused platform may be simpler to operate. If analysis spans marketing and business systems, the additional structure may be useful.
Make your final choice using a sample client workflow, not a generic demonstration. Check that the required sources connect, agreed metrics appear correctly and the format helps the reader act. The best fit connects reliable data to a useful decision with the least avoidable complexity.
Nodal AI: Performance Marketing Analytics
Nodal AI supports agencies seeking clearer performance analysis and less manual reporting. Its Performance Marketing Analytics and Automated Reporting offerings help bring marketing results into a consistent reporting process. Use the Nodal Platform to bring its analytics and reporting capabilities together, and Growth Recommendations to turn performance data into next steps.
Nodal AI is a good fit when channel data is fragmented, client reports require too much manual effort or teams need a clearer view of marketing performance. For a small, stable workflow, a simple spreadsheet may be enough. For broader analysis and automated reporting, Nodal AI can help turn marketing data into more useful insights.
Contact Nodal AI to discuss your agency’s reporting needs.
Make your next reporting cycle more useful
Treat reporting as a decision-making process, not just a document to deliver. Choose a recurring client question, then shape the report around the evidence needed to answer it and the action that could follow. This gives your team a practical way to improve the workflow without redesigning every dashboard at once.
When refining your approach to marketing reporting tools for agencies in the UK, look beyond how quickly a platform produces a report. Ask whether it helps your team interpret performance, explain the customer journey and identify growth opportunities. Nodal AI’s Performance Marketing Analytics supports that broader view, while the Nodal Platform brings the offering together with Growth Recommendations.
Make the next report clearer, more focused and easier to act on. A thoughtful reporting process gives your team and clients a stronger basis for decisions.
Frequently Asked Questions
What Are Marketing Agency Reporting Tools?
Marketing agency reporting tools gather campaign information and present it for analysis or client updates. An agency, for example, might use a dashboard to review paid search activity and prepare a separate client summary. Some tools focus on marketing reports, while business intelligence platforms support broader analysis. The key is whether a tool fits your sources, workflow and audience.
Which Client Reporting Tool Fits Your Agency?
The right tool suits your agency’s channels, client needs and reporting process. For recurring campaign summaries, prioritise reliable source connections and reusable report formats. If clients need to explore results themselves, look for interactive dashboards and suitable access controls. An agency with varied needs might shortlist both a dedicated reporting platform and a broader analytics tool.
Can I combine ad spend with CRM or revenue data?
Yes, if the workflow can bring the sources together and align their records. Matching campaign details with CRM outcomes, for example, can help connect advertising activity to later customer results. Agree on shared fields, such as campaign identifiers and reporting dates, before comparing totals. Treat attribution carefully: ad spend and revenue may represent different stages, so explain how records and outcomes are matched.
Can I switch from a dashboard tool without disrupting clients?
Plan a transition that keeps existing reports available while you test the replacement. Rebuild a representative client view, compare figures and date ranges with the current dashboard, then move one reporting workflow first. Keep the old report accessible during the changeover to preserve continuity for clients. When the new view produces consistent results, explain where clients can find future updates and when the format will change.
Do these tools handle UK GDPR?
No reporting platform makes an agency’s data handling compliant simply by being selected. UK GDPR governs how UK agencies process personal data, according to the Information Commissioner’s Office. Assess how your workflow handles access, storage, sharing and retention, and limit personal information to what the report needs. A dashboard of aggregated campaign results may require a different approach from one showing identifiable customer records.
What are the best marketing reporting tools for agencies in the UK?
There is no single best tool for every agency. Choose according to the work: Supermetrics connects data with spreadsheets and business intelligence tools, while Funnel focuses on collecting and transforming marketing data. Looker Studio presents visual reports, and broader BI platforms may suit more complex analysis. Compare actual source coverage, client workflows and reporting outputs before deciding.
Which tools offer white-label dashboards and client portals?
Look for agency reporting platforms with custom branding, client-specific access and a portal or shareable dashboard. These are distinct capabilities: a tool may support branded report exports without offering a dedicated client portal. Decide whether clients need a logo-led PDF, an interactive view or a self-service space, then compare tools against that use case. Test the client experience, including whether each report clearly identifies the right account.
Which tools integrate with Google Ads, GA4, Meta Ads, LinkedIn, and SEO platforms?
Connector coverage varies by tool, and the exact platform connection matters. Check each required source separately, including whether data arrives through a native connection or another import method. Nodal Platform lists integrations with Meta Ads, Google Marketing Platform and Google Analytics. For Google Ads, GA4, LinkedIn and SEO sources, assess the specific connector and fields available for your reporting workflow rather than assuming coverage.


