

Every static attribution model forces an arbitrary assumption onto your sales pipeline. When evaluating linear vs u-shaped attribution, you aren't discovering how buyers actually behave; you're simply choosing which rule should distribute the credit. As buyer journeys expand across multiple channels and devices, relying on rigid assumptions can quietly distort your marketing return on investment.
You already know that simplistic last-click reporting penalises upper-funnel activity and leaves you struggling to justify essential brand spend to stakeholders. You need a reporting structure that fairly reflects the collaborative influence of every paid ad, nurture sequence, and organic touchpoint across the entire customer journey.
This guide unpacks the exact mathematical weighting behind linear and position-based frameworks so you can match the right model to your commercial reality. We will explore how both structures allocate value, examine where static rules fall short, and outline a practical framework to help you establish clear, dependable multi-touch reporting.
Key Takeaways
- Master the mathematical mechanics of linear vs u-shaped attribution to understand exactly how each framework allocates revenue credit across your sales funnel.
- Identify why linear attribution excels for shorter consideration cycles by treating every touchpoint as an equal contributor to commercial revenue.
- Discover how U-shaped models safeguard top-of-funnel marketing investments by assigning 40 percent of conversion credit to initial discovery and lead creation milestones.
- Apply a structured evaluation framework that matches your sales cycle length, touchpoint volume, and channel complexity to the most appropriate reporting model.
- Recognise the practical limits of static rules and see how connecting fragmented data systems prepares your organisation for predictive, data-driven intelligence.
Understanding Marketing Attribution: Why Model Selection Governs Budget Allocation
Every commercial decision in performance marketing rests on a foundational premise: knowing which channels generate actual revenue. At its core, marketing attribution evaluates the series of interactions a customer takes before converting, assigning commercial value to each touchpoint. When your attribution framework functions correctly, it directs capital toward channels that expand the bottom line. When it misfires, it systematically starves high-performing campaigns of vital funding.
Most commercial teams realise that buyer paths are rarely direct. B2B buyer journeys now involve an average of 6 to 8 touchpoints before reaching a conversion milestone. Evaluating linear vs u-shaped attribution has therefore become a pivotal exercise for marketers seeking to replace legacy reporting with balanced, multi-touch frameworks.
The Limitations of Single-Touch Attribution
Single-touch attribution relies on binary rules that compress complex human behaviour into an isolated event. First-touch models over-index on initial discovery, giving full credit to early impressions while completely ignoring the channels that closed the deal. Conversely, last-touch models deliver a distorted view by heavily rewarding bottom-of-funnel touchpoints:
- Over-crediting brand search: Last-click rules frequently allocate total conversion value to direct traffic or branded paid search, channels that simply harvest demand generated elsewhere.
- Defunding upper-funnel growth: When mid-funnel nurture emails, non-branded search, and prospecting social campaigns receive zero commercial credit, finance leaders inevitably trim their budgets.
- Pipeline blind spots: Evaluating pipeline health on a single click creates false confidence, hiding severe drop-offs occurring throughout the consideration phase.
The Rise of Multi-Touch Heuristic Models
Multi-touch heuristic models resolve this myopic view by distributing fractional conversion value across every recorded engagement. Rather than declaring an arbitrary single winner, these rule-based structures use defined mathematical equations to map revenue back to the wider pipeline.
Unlike dynamic algorithmic systems, heuristics follow fixed rules. Deciding between linear vs u-shaped attribution requires evaluating your sales cycle duration and touchpoint density. Linear models treat the entire journey as an egalitarian team effort, whereas U-shaped frameworks assign strategic weight to specific conversion milestones. For marketing teams taking their first steps away from last-touch reporting, selecting the appropriate heuristic creates immediate operational clarity.
Linear Attribution Explained: Equal Weight Across Every Touchpoint
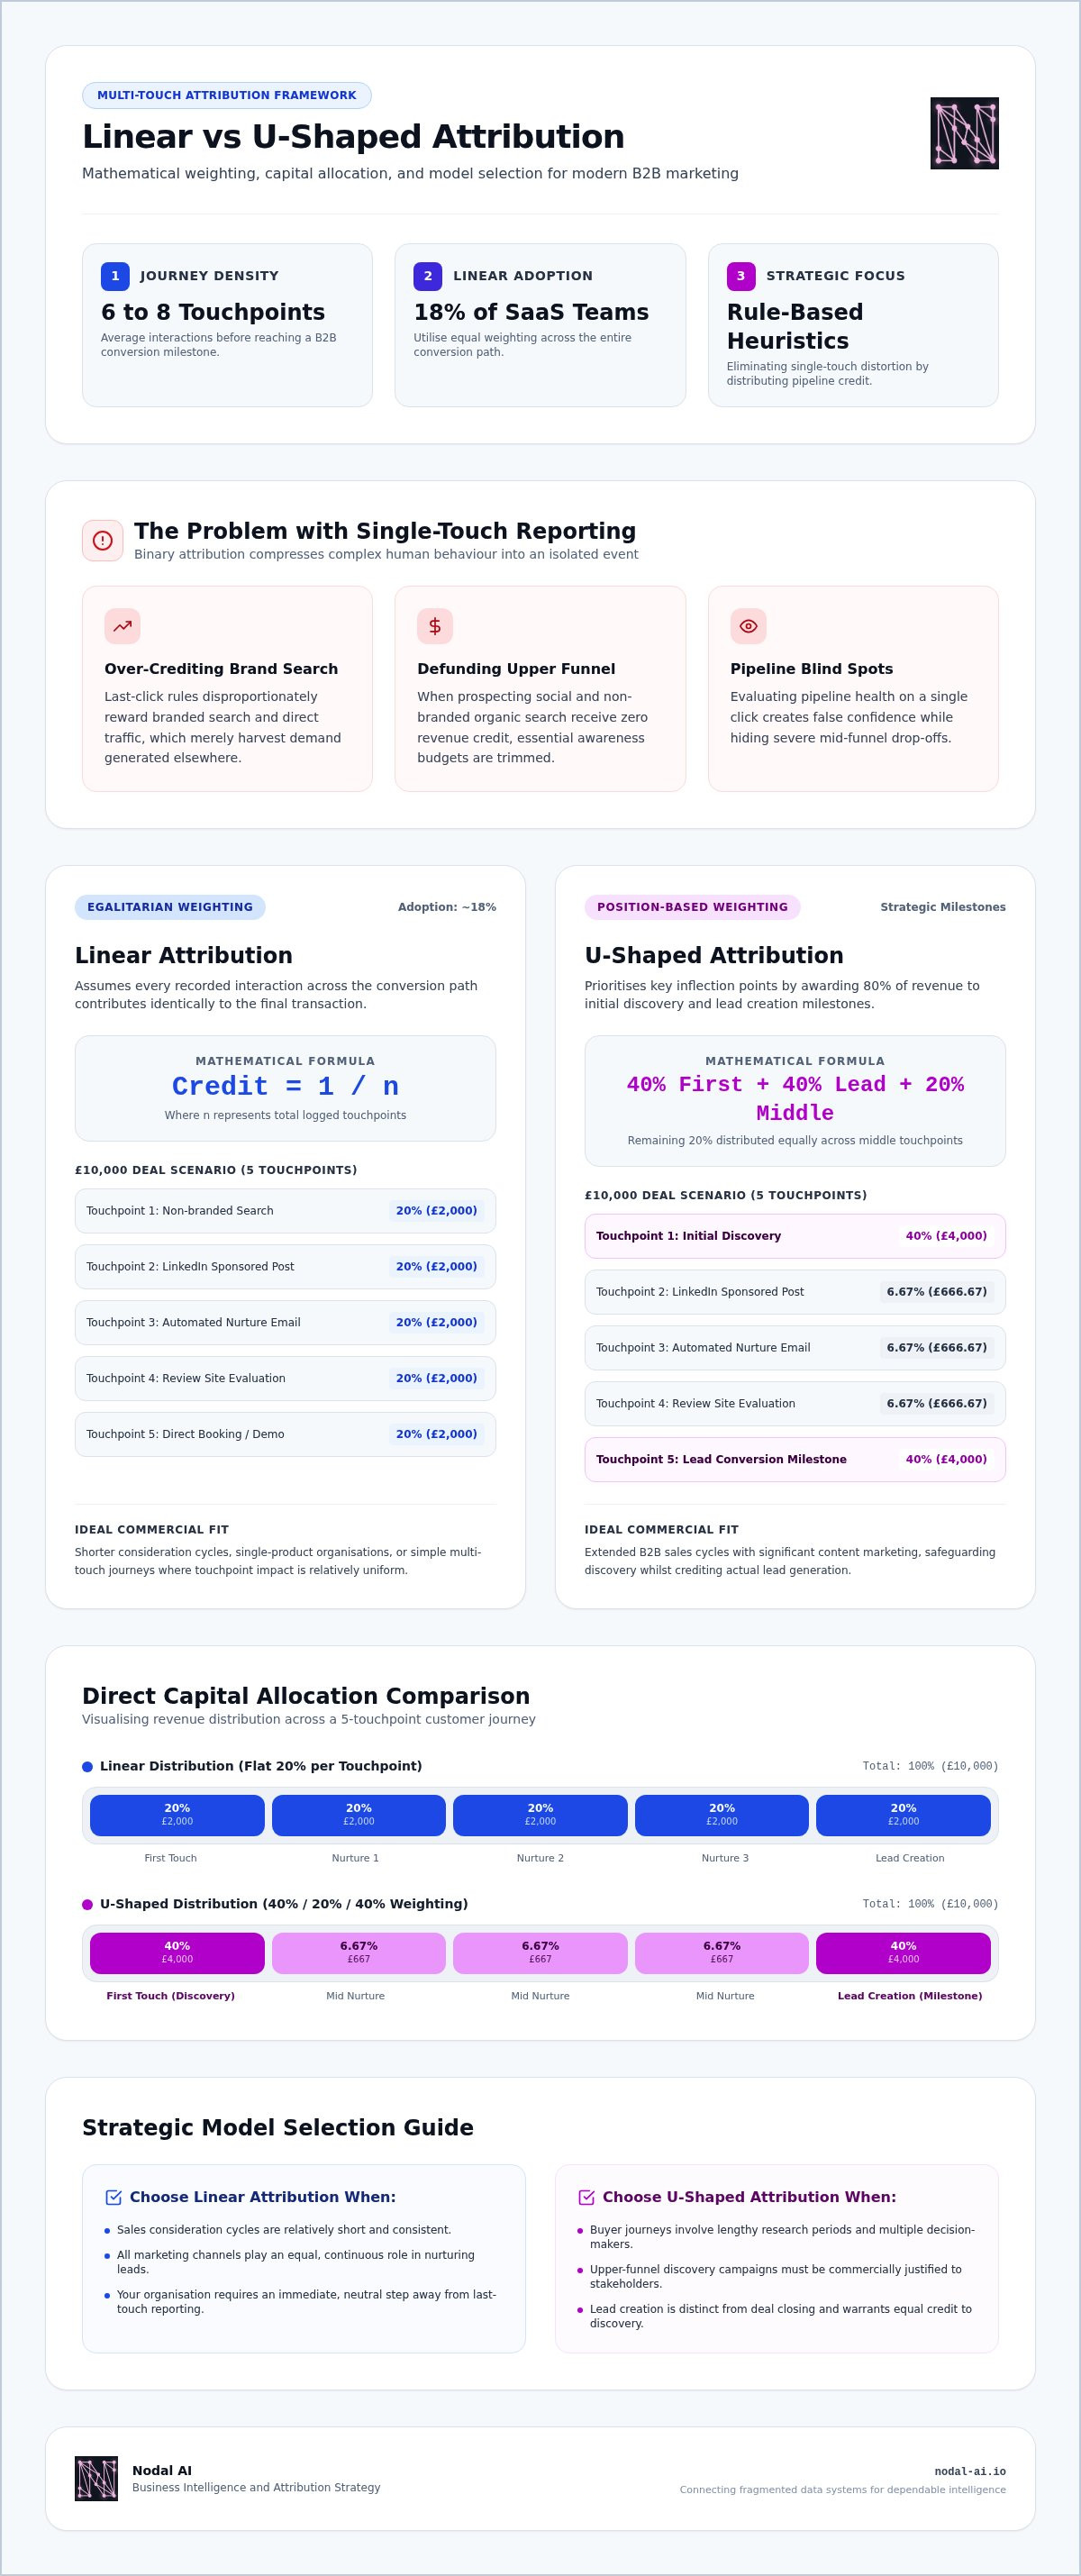
Linear attribution operates on absolute egalitarianism. It assumes that every recorded interaction across the conversion path contributes identically to the final transaction. By dividing 100 percent of the conversion value across all logged sessions, it eliminates the bias inherent in single-touch reporting.
In B2B SaaS environments, industry benchmarks show linear attribution is adopted by roughly 18 percent of organisations seeking a straightforward multi-touch perspective. While it avoids assigning absolute credit to a single event, understanding the mechanics of linear vs u-shaped attribution reveals both the simplicity and operational hazards of equal distribution. For teams looking to formalise their broader measurement strategy, mastering marketing attribution requires dissecting how these formulas allocate capital in practice.
How the Linear Mathematical Formula Operates
The mathematical distribution is disarmingly simple: credit per touchpoint equals 1 divided by n, where n represents the total number of logged touchpoints. Consider a concrete scenario involving a £10,000 enterprise contract with five distinct interactions:
- Touchpoint 1 (Non-branded Organic Search): 20% credit (£2,000)
- Touchpoint 2 (LinkedIn Paid Sponsored Post): 20% credit (£2,000)
- Touchpoint 3 (Automated Nurture Email Click): 20% credit (£2,000)
- Touchpoint 4 (G2 Review Site Referral): 20% credit (£2,000)
- Touchpoint 5 (Direct Navigation Demo Request): 20% credit (£2,000)
Regardless of channel friction or position, every touchpoint receives identical credit. This transparent calculation integrates cleanly into basic spreadsheets and multi-touch reporting dashboards.
Key Advantages of the Linear Framework
Linear attribution dismantles internal marketing silos. Top-funnel social teams and bottom-funnel paid search specialists stop arguing over pipeline ownership because every stage shares revenue recognition. It also demonstrates the collective value of middle-funnel assets, proving to stakeholders that educational guides and nurture sequences actively support pipeline progression.
Inherent Weaknesses and Blind Spots
Equal distribution introduces dangerous strategic distortions. The formula cannot distinguish between high-intent commercial catalysts and routine background engagements:
- False equivalence: An accidental click on an automated order confirmation receives the exact same fiscal recognition as a high-intent consultation request.
- Budget inflation: Low-impact channels appear falsely productive, encouraging media buyers to increase expenditure on passive display networks that merely pad touchpoint counts without driving pipeline velocity.
- Catalyst blindness: By smoothing out the distribution, linear models obscure the decisive discovery and closing channels that genuinely move buyers across the conversion line.
To eliminate manual reporting errors and evaluate your true channel performance across disparate touchpoints, explore how the Nodal Platform unifies fragmented customer journeys.
U-Shaped Attribution Explained: Prioritising Discovery and Lead Creation
U-shaped attribution, often categorised as position-based modelling, rejects the notion that every marketing interaction possesses equal commercial weight. Instead, it reflects a foundational strategic reality: initiating interest and securing commitment are usually the hardest milestones in any buying cycle. When comparing linear vs u-shaped attribution, the U-shaped model reallocates credit to reflect these pivotal inflection points.
According to industry benchmarks, roughly 22 percent of UK B2B marketing organisations utilise position-based attribution. It provides a structured compromise, acknowledging the collaborative nature of multi-channel journeys without diluting the significance of early brand awareness and final conversion catalysts.
The 40-20-40 Weighting Structure
The standard position-based framework applies a distinct mathematical rule: 40 percent of revenue credit goes to the first touchpoint, 40 percent goes to the lead-creation or final conversion touchpoint, and the remaining 20 percent is split equally across all intermediary touches. The formula for any middle touchpoint is simply 20% divided by (n - 2), where n represents the total count of touchpoints.
Applying this formula to a £10,000 transaction with five interactions produces a clear shift in fiscal allocation:
- Touchpoint 1 (Paid Social Ad Click): 40% credit (£4,000)
- Touchpoint 2 (Webinar Registration): 6.67% credit (£666.67)
- Touchpoint 3 (Product Specification Download): 6.67% credit (£666.67)
- Touchpoint 4 (Case Study Review): 6.67% credit (£666.67)
- Touchpoint 5 (Commercial Proposal Submission): 40% credit (£4,000)
Strategic Benefits for Multi-Stage Journeys
This distribution provides immediate structural protection for top-of-funnel budgets. Paid prospecting campaigns, influencer partnerships, and digital PR efforts receive the fiscal recognition they deserve, preventing stakeholders from prematurely cutting brand discovery budgets. At the same time, bottom-of-funnel conversion tools maintain strong validation, making this model especially effective for high-consideration purchases and lengthy consideration cycles.
Limitations of Position-Based Modelling
Despite its balance, position-based weighting introduces clear systemic blind spots. The model undervalues critical mid-funnel interactions, treating an in-depth product demonstration or a bespoke pricing enquiry as minor intermediary steps. Because the 40-20-40 split relies on arbitrary assumptions rather than verified incrementality, it forces every customer journey into an identical mould. While assessing linear vs u-shaped attribution helps teams graduate from single-touch models, both frameworks remain rigid heuristics that cannot account for unexpected shifts in buyer behaviour.
Linear vs U-Shaped Attribution: Head-to-Head Comparison Framework
Choosing between competing multi-touch models requires matching reporting mechanics directly to your commercial architecture. Deciding between linear vs u-shaped attribution is not a question of theoretical superiority; it depends entirely on your sales velocity, consideration windows, and how your marketing channels collaborate to generate revenue. To evaluate these pathways effectively, review our guide on customer journey mapping to identify every critical buyer milestone.
Evaluating by Sales Cycle and Consideration Time
Shorter sales cycles with low purchase friction thrive under linear models. If a buyer views a social post, clicks an organic search result, and purchases within 48 hours, equal distribution accurately reflects that compact journey. Conversely, extended buying cycles spanning weeks or months require the milestone weighting of U-shaped attribution. In high-consideration sectors like hospitality or B2B enterprise software, prospects conduct extensive preliminary research across disparate devices before executing a booking or proposal. A position-based framework correctly preserves the financial value of that critical discovery moment alongside the closing touch.
Budget Allocation and Media Mix Impact
Your attribution selection directly dictates where media buyers direct capital:
- Linear media impact: Spreads budget democratically across brand discovery, retargeting, and lifecycle marketing, preventing any single media manager from claiming outsized success.
- U-shaped media impact: Justifies aggressive capital deployment into paid awareness channels and dedicated conversion-rate optimisation, while keeping mid-funnel content investments lean.
- Cross-channel governance: Organisations adopting multi-touch frameworks report average budget reallocations of 18% to 22%, shifting spend towards genuinely incremental channels.
Decision Matrix for Commercial Teams
Use this evaluation matrix to select the right heuristic for your current commercial structure:
- Select Linear if: Your path to purchase is relatively short (under 14 days), your content channels serve primarily as continuous brand reinforcement, and you operate an agile, non-siloed marketing department.
- Select U-Shaped if: Your buying cycle involves deliberate committee evaluation, you maintain distinct teams focused separately on lead generation and deal closing, and you must justify aggressive top-of-funnel acquisition expenditure.
Both models ultimately rely on fixed, subjective formulas rather than real-time incrementality. Treating them as comparative baselines allows you to see directional trends while working towards true pipeline intelligence.
Explore Nodal Platform features
Beyond Static Rules: Upgrading to AI-Driven Predictive Attribution
Static attribution rules are useful stepping stones away from single-touch blindness, but they inevitably break down in modern multi-channel environments. Comparing linear vs u-shaped attribution highlights the limitations of fixed percentages: neither model measures actual incrementality. If your attribution assumes how buyers behave rather than analysing empirical evidence, your budget allocation remains grounded in guesswork.
Real-world journeys do not follow neat formulas. Prospective customers switch devices, engage with walled gardens like Meta and Google, and finalise bookings across separate operational systems. Transitioning to advanced intelligence platforms allows marketing teams to measure genuine causal lift and eliminate data fragmentation across the entire commercial pipeline.
Overcoming Data Fragmentation Across Enterprise Channels
Modern attribution struggles primarily because commercial data sits in isolated silos. Web analytics track sessions, ad networks report platform clicks, and backend revenue settles inside property management systems (PMS), point-of-sale (POS) tools, or enterprise CRMs. This disconnect distorts static reporting by severing the relationship between ad impressions and actual gross revenue.
Consolidating disparate data across Google Ads, Meta, GA4, and commercial booking engines resolves these blind spots. By unifying online interactions with offline transactions, commercial leaders gain full visibility into direct conversion paths, reducing third-party platform leakage and eliminating duplicate conversion counts.
The Advantage of Algorithmic and Predictive Modelling
Predictive modelling replaces subjective percentage rules with machine learning. Instead of forcing journeys into a static 40-20-40 or equal-split structure, algorithmic attribution evaluates thousands of touchpoint sequences to isolate the real statistical impact of every interaction.
These advanced systems analyse historical transaction patterns alongside live pipeline velocity to project future conversion volume proactively. The commercial impact is substantial. Nodal AI assisted Ovolo Hotels in achieving a 24.5% increase in ROAS by identifying true channel incrementality. Across hospitality clients, resolving tracking fragmentation and applying predictive intelligence has reduced acquisition costs by 15.3%.
Selecting the Optimal Attribution Architecture for Your Business
Evaluate your current measurement setup realistically. If your data is siloed and your technical stack is emerging, static comparisons provide a helpful baseline. When your organisation manages multi-channel campaigns across complex offline and online operations, relying solely on linear vs u-shaped attribution introduces expensive blind spots. Upgrading to automated reporting and algorithmic models turns passive analytics into proactive commercial intelligence.
Take control of your customer journeys. Book a demo with Nodal AI to modernise your attribution architecture and scale marketing performance with confidence.
Transforming Attribution from Static Formulas to Commercial Growth
Evaluating linear vs u-shaped attribution provides vital clarity over simplistic single-touch models, allowing you to match revenue credit to your unique sales cycle. Yet, both frameworks remain static approximations. Lasting commercial growth requires moving past fixed percentage formulas by unifying fragmented operational data across booking engines, PMS, POS, and digital ad networks into a cohesive multi-touch attribution engine.
Connecting this fragmented landscape delivers measurable commercial impact. Brands that consolidate these disparate touchpoints, such as Ovolo Hotels, have driven a 24.5% increase in ROAS while cutting customer acquisition costs by 15.3% through predictive modelling.
Book a demo with Nodal AI to transform your marketing attribution
Equip your commercial team with automated reporting and objective performance insights, giving you complete confidence to invest in the channels that genuinely scale your business.
Frequently Asked Questions
What is the primary difference between linear and U-shaped attribution?
The primary difference lies in how revenue credit is weighted across touchpoints. Linear attribution distributes 100 percent of the conversion value equally among all recorded interactions. In contrast, U-shaped attribution assigns 40 percent to the first touch, 40 percent to the lead-creation or final conversion touch, and splits the remaining 20 percent among middle interactions. Deciding between linear vs u-shaped attribution depends on whether your commercial model prioritises key conversion milestones or continuous customer nurturing.
When should an organisation choose linear attribution over other models?
An organisation should choose linear attribution when marketing operations rely on short sales cycles, typically under 14 days, where each touchpoint plays an equivalent role in maintaining brand momentum. It functions exceptionally well for teams wanting a transparent, collaborative multi-touch view that prevents internal competition between paid acquisition and retention channels. If your customer journeys involve frequent low-friction touchpoints rather than prolonged discovery phases, linear modelling provides clear directional visibility.
Why does U-shaped attribution allocate 40 percent to the first and last touches?
U-shaped attribution allocates 40 percent to both ends of the journey because initiating brand discovery and securing commercial commitment are usually the hardest conversion hurdles. The initial touchpoint represents successful prospecting against cold audiences, while the final touchpoint secures revenue. Awarding 80 percent of total credit to these bookends protects acquisition budgets and validates conversion channels, while leaving 20 percent to acknowledge intermediary nurturing assets.
How do linear and U-shaped attribution compare to data-driven attribution?
Linear and U-shaped frameworks are static heuristic models that follow rigid, pre-programmed percentage formulas regardless of real conversion impact. Data-driven attribution uses machine learning to evaluate historical customer paths, assigning dynamic credit based on each touchpoint's actual statistical influence. While comparing linear vs u-shaped attribution helps teams move past single-touch reporting, algorithmic models eliminate arbitrary guesswork by adjusting weightings based on empirical lift and pipeline velocity.
Can rule-based attribution models track offline interactions and conversions?
Standard rule-based models cannot track offline conversions on their own because they rely on web analytics sessions and browser tags. Connecting offline transactions from property management systems (PMS), point-of-sale (POS) hardware, or enterprise CRMs requires an integrated data layer. Platforms like Nodal AI resolve this fragmentation by unifying offline booking engines and in-person transactions with digital touchpoints, enabling multi-touch attribution across your entire customer lifecycle.
Does Google Analytics 4 support linear and U-shaped attribution models?
Google Analytics 4 no longer supports linear or U-shaped models as primary reporting options. Google retired these rule-based frameworks in late 2023, switching standard reporting to Data-Driven Attribution and last-click alternatives. Marketers can now access linear and position-based models only within model comparison reports. Organisations wanting to use custom U-shaped models natively must export raw event data to BigQuery or deploy independent multi-touch analytics platforms.
How does marketing attribution impact overall return on ad spend?
Marketing attribution impacts return on ad spend by revealing which channels genuinely generate incremental revenue rather than simply harvesting existing demand. Research demonstrates that implementing multi-touch attribution prompts organisations to reallocate 18% to 22% of their budgets to higher-performing campaigns. By eliminating wasted spend on redundant retargeting and validating top-of-funnel prospecting, businesses routinely lower customer acquisition costs and increase overall campaign profitability.


