

A 4:1 return on ad spend is often called the industry gold standard, yet thousands of marketers watch their margins shrink while their dashboards stay green. If you're tired of digging through fragmented spreadsheets only to find inconsistent data across Meta and Google, you're not alone. Truly understanding what is roas goes far beyond a simple division problem. It's about connecting the dots between your ad spend and actual profitable growth.
You've likely felt the anxiety of miscalculated marketing spend when a 3.52x median ROAS on Google Ads doesn't translate to bottom line profit. We'll help you master the fundamentals and show you how to transform fragmented data into a clear strategy for sustainable revenue. From basic math to navigating the August 2026 EU AI Act, this guide provides a clear formula to use today while teaching you to make smarter, data-driven decisions that separate ROAS from ROI. It's time to stop guessing and start talking to your data.
Key Takeaways
- Master the core definition of what is roas and why this efficiency metric is the anchor of your 2026 strategy in a fragmented data ecosystem.
- Learn to calculate your true return by aggregating total attributable revenue against all ad spend, including often-overlooked platform fees.
- Discover why a universal benchmark is a myth and how to identify your unique break-even point based on your actual profit margins.
- Solve the "Silo Problem" by identifying the attribution gaps that cause different platforms to over-report identical sales.
- Move from manual spreadsheets to automated reporting to save 3,000 hours a year while using predictive modelling to scale smarter.
Defining Return on Ad Spend (ROAS): Why It Matters in 2026
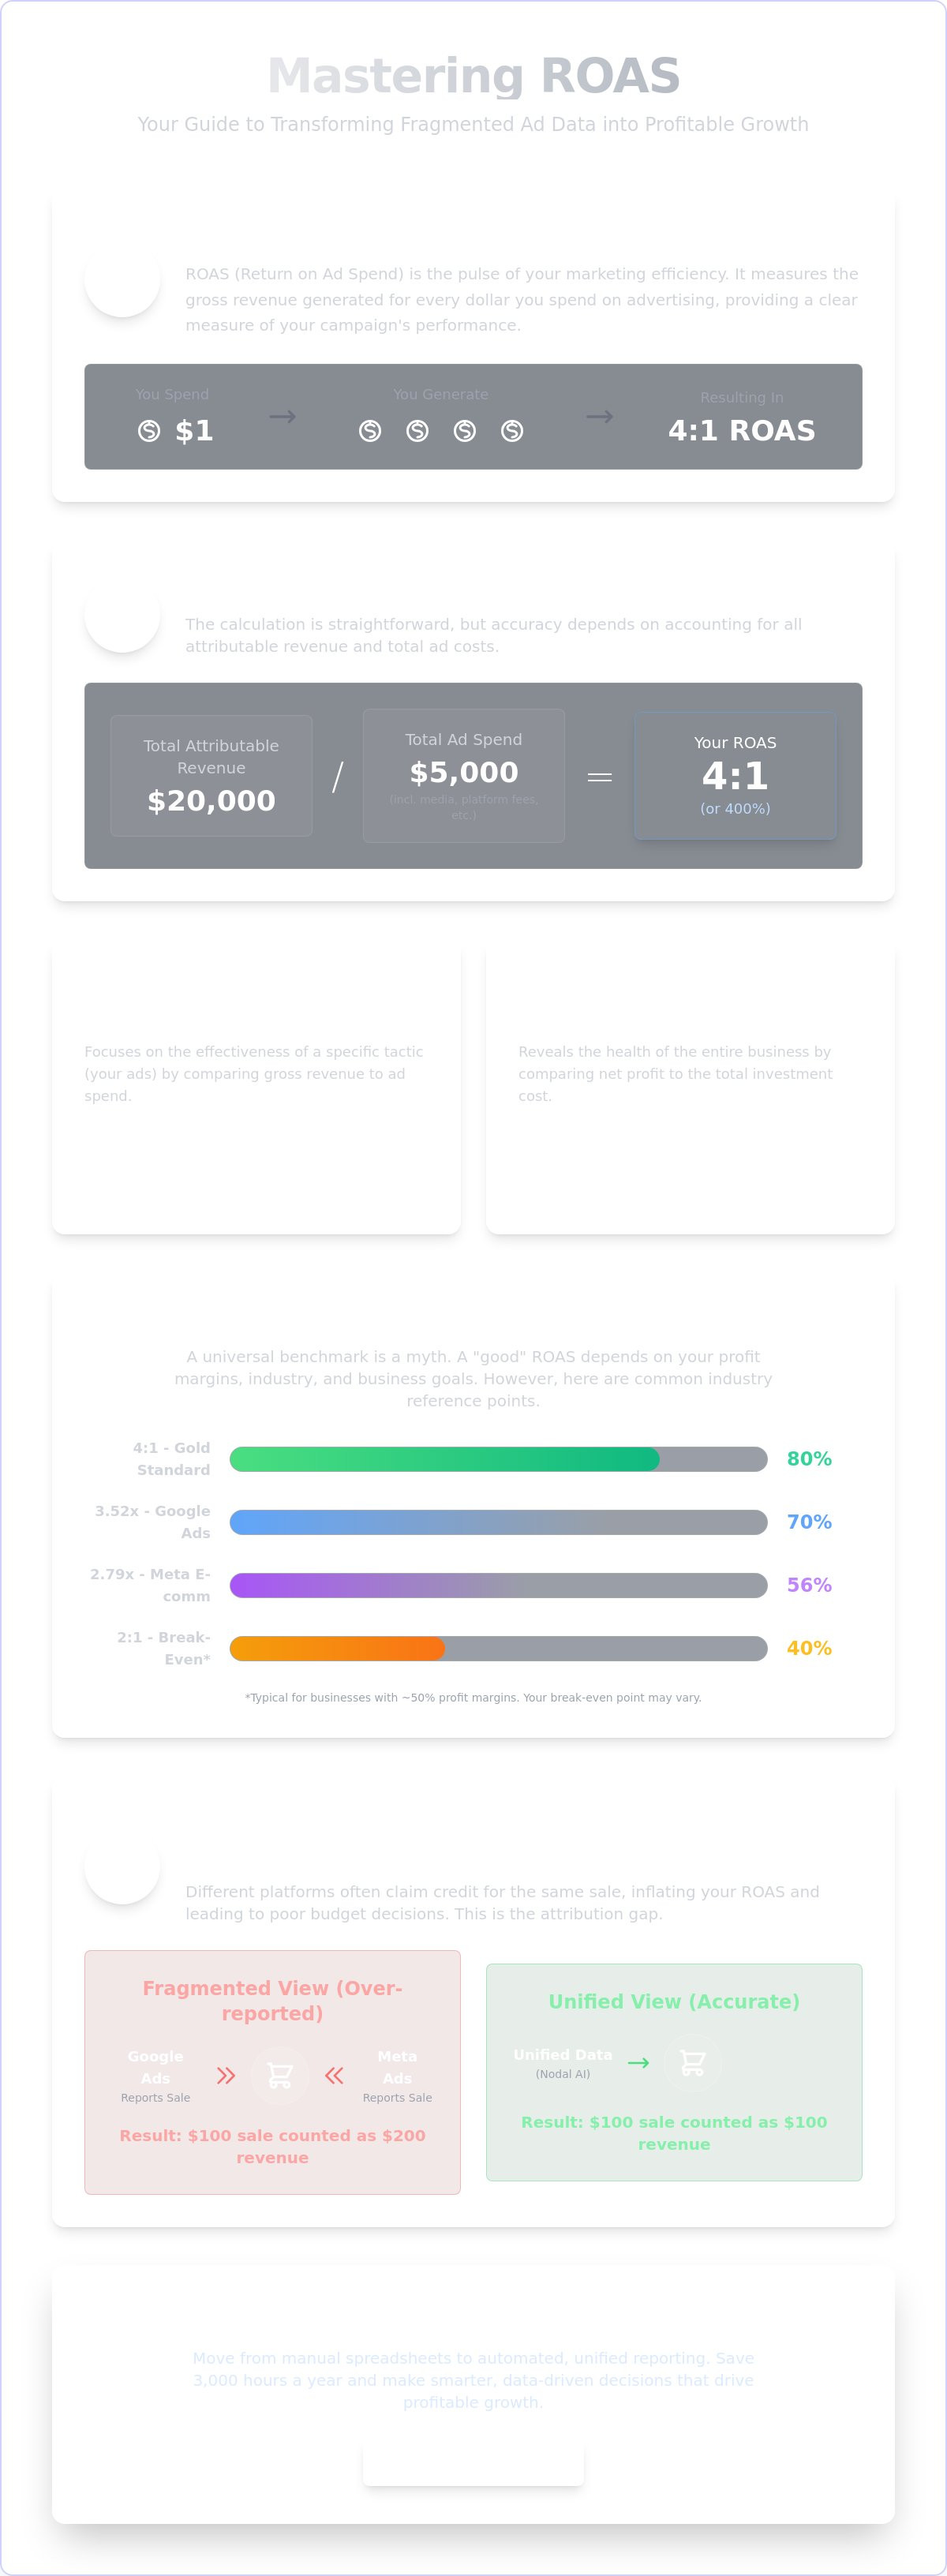
ROAS isn't just a column in a report; it's the pulse of your marketing efficiency. At its core, understanding what is roas requires looking at the gross revenue generated for every dollar or pound you commit to advertising. If your campaign spends $1,000 and returns $5,000 in sales, you've achieved a 5:1 ratio. This metric tells you exactly how hard your capital is working in the field. It's the primary tool for turning fragmented data into profitable decisions.
The marketing landscape of 2026 is a complex, fragmented data ecosystem. With the EU AI Act taking effect in August 2026 and strict new privacy laws in Arkansas and Virginia, the "data noise" has reached a fever pitch. Relying on gut feeling or siloed platform metrics is a recipe for spend-related anxiety. ROAS cuts through the static. It provides the emotional relief of strategic clarity; it allows you to move from "I think this is working" to "I know this is profitable." It's your first step toward learning how to talk to your data effectively.
The Role of ROAS in Modern Business Intelligence
ROAS acts as a high-level pulse check for your overall marketing health. It doesn't just measure the past; it informs your future growth recommendations. By understanding your current efficiency, you can identify which channels deserve more fuel and which require a total pivot. For example, knowing the median ROAS on Google Ads is currently 3.52x gives you a benchmark to measure your own performance against. These simple metrics serve as the essential foundation for more complex predictive modelling. You can't forecast future success without a clear grasp of your current baseline. Connect the dots between spend and revenue to see where your next opportunity lies.
ROAS vs. ROI: Clearing the Confusion
Many marketers use these terms interchangeably, but they serve different masters. ROAS measures efficiency by looking at revenue; ROI measures effectiveness by looking at profit. You need both to see the full picture of your performance. While a high ROAS suggests your ads are attractive to customers, a low ROI might reveal that your operational costs are eating your margins. ROI specifically accounts for the total cost of goods sold and business overheads that exist outside of your direct ad spend. One tracks the success of a specific tactic, while the other tracks the health of the entire business.
How to Calculate ROAS: A Step-by-Step Guide
Calculating your return is a logical journey that moves you from fragmented data to profitable decisions. While Coursera defines ROAS as a fundamental marketing metric, the actual execution in a 2026 landscape requires precision. You must look beyond the surface level of your dashboard to find the truth. Follow these five steps to get a clear pulse on your performance:
- Step 1: Identify Attributable Revenue. Isolate the total gross revenue generated by a specific campaign or channel over a set period.
- Step 2: Aggregate Total Ad Spend. Collect every penny spent on media, including often-hidden platform fees or currency conversion costs.
- Step 3: Apply the Formula. Divide your total revenue by your total ad spend (Revenue / Spend = ROAS).
- Step 4: Interpret the Ratio. Express your result as a ratio like 4:1 or a percentage like 400%.
- Step 5: Benchmark for 2026. Compare your results against current medians, such as the 3.52x ROAS for Google Ads or the 2.79x median for Meta e-commerce campaigns.
Understanding what is roas in a practical sense means recognizing that the formula is simple, but the inputs are often complex. If you don't account for every dollar, your "clarity" is just a well-disguised guess. Connect the dots between your bank account and your ad manager to see the real picture.
Calculating Revenue Attributable to Ads
The challenge today isn't a lack of data; it's the "Silo Problem" where Meta and Google both claim credit for the same $100 sale. To avoid double-counting, you must use robust UTM parameters and detailed customer journey data. This allows you to track conversions across multiple touchpoints without inflating your numbers. When you talk to your data through a unified lens, you stop overvaluing certain channels and start seeing where the growth actually lives.
What Should You Include in 'Ad Spend'?
Direct media costs are the baseline, but they rarely tell the whole story. Many businesses debate whether to include agency fees or creative production costs in their calculation. While ROAS usually focuses on media spend to measure channel efficiency, excluding these costs can lead to a false sense of profitability. The Nodal Platform automates the ingestion of these fragmented costs, providing a unified view that accounts for every technical fee and platform charge. This level of automated reporting saves you from digging through spreadsheets and ensures your "smarter decisions" are based on the full financial truth.
What is a 'Good' ROAS? Benchmarks and Variables
If you ask ten marketers what a "good" return looks like, you'll get ten different answers. While a 4:1 ratio is often cited as a general benchmark, the reality of what is roas in 2026 is far more nuanced. It's a compass, not a fixed destination. Defining what is roas for your specific brand requires a deep dive into your unit economics and profit margins. A 3.0x return might be a disaster for a low-margin electronics retailer but a massive win for a high-margin software provider.
Market trends in April 2026 show significant variation across platforms and industries. For instance, Beauty and Personal Care brands on Google Ads currently see a 6.1x median ROAS, while Fashion and Apparel brands hover around 4.8x. As BigCommerce on calculating ROAS highlights, e-commerce success depends on aligning these numbers with your unique overheads. To grow smarter, you must also look at your content marketing roi alongside paid spend to ensure your ecosystem remains balanced as CPCs rise.
Factors That Influence Your Target ROAS
Your target depends heavily on your industry and product type. High-margin luxury goods can often sustain a lower ROAS because the absolute profit per sale is high. Conversely, low-margin commodities like food and beverages, which saw a 3.2x median on Google Ads in early 2026, require high efficiency to remain viable. You must also connect the dots between Customer Acquisition Cost (CAC) and Lifetime Value (LTV). If your retention is high, you can afford to be less efficient on the first sale to capture long-term revenue.
The Break-even ROAS Formula
To find your floor, you must calculate your break-even point. The formula is simple: 1 divided by your Gross Profit Margin percentage. If your margin is 25%, your break-even ROAS is 4.0x; anything lower means you're losing money on every sale. However, scaling spend at a lower ROAS can sometimes lead to higher total profit if the volume increase compensates for the efficiency drop. A high customer lifetime value allows a business to sustain a lower initial ROAS because the long-term profit outweighs the high acquisition cost. Use this clarity to move from data noise to strategic scaling.
Why Your ROAS Might Be Lying: The Attribution Gap
Your dashboard shows a 5:1 return, but your bank account tells a different story. This discrepancy is the attribution gap. Understanding what is roas on paper is easy; understanding it in the context of a multi-channel ecosystem is where most marketers lose their way. The "Silo Problem" occurs when Meta and Google both claim credit for the same conversion, leading to a fragmented view of your performance. If you base your scaling decisions on these disconnected dots, you're likely overspending on channels that aren't actually driving incremental growth.
Relying on platform-reported data alone is a dangerous game. When every platform claims to be the hero, your total reported revenue can easily exceed your actual sales. This creates a false sense of security that leads to misallocated budgets and missed targets. To grow smarter, you must reconcile these numbers against your actual bottom line. It's the difference between looking at a snapshot and seeing the entire movie.
Platform Inflation vs. Reality
Platform-reported ROAS is often 20 to 30% higher than the actual revenue hitting your accounts. This isn't necessarily malicious. It's a byproduct of siloed tracking. Since the privacy shifts of iOS 14 and the tighter restrictions of the August 2026 EU AI Act, tracking accuracy has plummeted. Platforms now rely heavily on modeled data to fill the gaps, which often paints an overly optimistic picture. You need a "Unified Metric" that reconciles all data sources to find true clarity. This stops the anxiety of digging through spreadsheets and replaces it with actionable insights.
The Role of Multi-Touch Attribution
Last-click attribution is a relic of a simpler time. It oversimplifies the customer journey by giving all the credit to the final touchpoint. Truly answering what is roas requires giving credit to the "assist." This means valuing the top-of-funnel awareness ads that started the journey before a final search ad closed the deal. Without multi-touch attribution, you might kill "wasteful" spend that is actually the primary driver of your brand discovery. Transitioning from fragmented metrics to strategic intelligence allows you to identify which ads truly move the needle. You can finally connect the dots with multi-touch attribution to see the real impact of your spend across the entire funnel.
How to Improve ROAS: From Data to Profitable Decisions
Many marketers view what is roas as a historical record of what happened last month. That's a mistake. In the 2026 landscape, looking backward is the fastest way to fall behind. To truly improve your returns, you must shift your focus from post-mortem analysis to proactive optimization. Stop digging through fragmented spreadsheets and manual reports. This outdated process wastes over 3,000 hours a year for the average enterprise marketing team. Automated reporting isn't just a convenience; it's the only way to gain the speed required to stay competitive.
When you talk to your data, you uncover patterns that human analysts simply miss. AI-powered business intelligence engines don't just count sales; they identify the subtle signals in the fragmented data ecosystem that precede a conversion. By moving to a model of automated growth recommendations, you stop reacting to the past and start engineering the future. This shift provides the clarity needed to turn a "good" ROAS into an exceptional one.
Leveraging AI for Predictive ROAS
Historical data is only useful if it informs the next dollar spent. Predictive modelling allows you to forecast which campaigns will scale effectively before you commit your budget. Instead of waiting for a weekly review, you can shift spend in real-time to high-performing audience clusters. This level of automated media planning ensures your capital always flows toward the highest potential return. The Nodal Platform provides these growth recommendations instantly, allowing you to grow smarter by focusing on future revenue rather than past mistakes. It's about moving from data noise to strategic clarity.
Optimising the Customer Journey
Improving what is roas also requires a deep look at where revenue is leaking. Every friction point identified in your customer journey mapping is a lost opportunity for profit. By identifying exactly where potential customers drop off, you can personalise the experience to increase both conversion rates and lifetime value. While a 2.79x median ROAS on Meta is the industry average for e-commerce in 2026, those who optimize the entire journey often exceed these benchmarks. It is time to transform your fragmented data into profitable decisions with Nodal AI and take control of your growth.
From Data Noise to Strategic Clarity
Understanding what is roas is the first step toward reclaiming your marketing budget from the chaos of fragmented spreadsheets. You've seen how the 3.52x median on Google Ads is just a baseline and why the attribution gap often hides the real truth about your profit. True growth in 2026 requires more than historical reporting; it requires the ability to talk to your data and act on predictive insights before the competition does.
London teams are already saving 3,000 hours a year by automating their manual reporting and shifting focus to sustainable revenue. By implementing enterprise-level multi-touch attribution, you finally stop double-counting sales and start identifying which ads truly drive incrementality. The path from complexity to clarity is closer than you think. You have the power to turn unified metrics into a competitive advantage and make smarter decisions with confidence.
Connect the dots and grow smarter with the Nodal Platform. Use AI-powered growth recommendations to transform your performance marketing into a predictable engine for success today.
Answers to Common ROAS Questions
Is ROAS the same as ROI?
No, they measure different aspects of your performance. ROAS tracks the gross revenue generated for every dollar spent on advertising to measure campaign efficiency. ROI measures the net profit after all business expenses are subtracted to determine the total effectiveness of your investment.
What is a good ROAS for Google Ads in 2026?
The median ROAS on Google Ads is 3.52x as of April 2026. While a 4:1 ratio is a common industry benchmark, a "good" number depends entirely on your profit margins. High-margin brands might thrive at a 3:1 ratio, while low-margin retailers may need a 6:1 return to stay profitable.
How do I calculate ROAS if I have offline conversions?
You must connect your CRM data to your advertising platforms to attribute in-store or phone sales to digital touchpoints. By uploading hashed lead data, you can bridge the gap between online spend and offline revenue. This provides a unified view of what is roas across your entire sales ecosystem.
Can ROAS be higher than 100%?
Yes, and it usually must be for a business to survive. A 100% ROAS means you earned exactly $1 for every $1 spent, which is a break-even on media alone. Most successful brands aim for 400% or 500% to ensure they cover product costs and overhead.
What happens if my ROAS is below 1.0?
A ROAS below 1.0 indicates that your ad spend is higher than the revenue it generates. You're losing money on the media buy itself before considering other business costs. This is a clear signal to stop digging in spreadsheets and start refining your targeting or customer journey mapping.
How does Nodal AI help improve my ROAS?
Nodal AI uses predictive modelling to forecast which campaigns will scale before you spend your budget. It identifies trends that human analysts miss and provides growth recommendations in real-time. This allows you to shift capital toward high-performing clusters and away from wasteful spend.
Why is my ROAS different in Google Analytics vs. Facebook Ads?
This discrepancy is caused by the "Silo Problem" where platforms use different attribution models. Facebook often includes view-through conversions, while Google Analytics defaults to last-click. Truly understanding what is roas requires multi-touch attribution to reconcile these fragmented data sources into a single truth.
Does ROAS account for recurring subscription revenue?
Standard ROAS calculations typically only include the value of the initial transaction. To see the full picture of subscription growth, you should look at Customer Lifetime Value (CLV). Integrating long-term revenue data into your reporting allows you to make smarter decisions about how much you can afford to spend on acquisition.


