

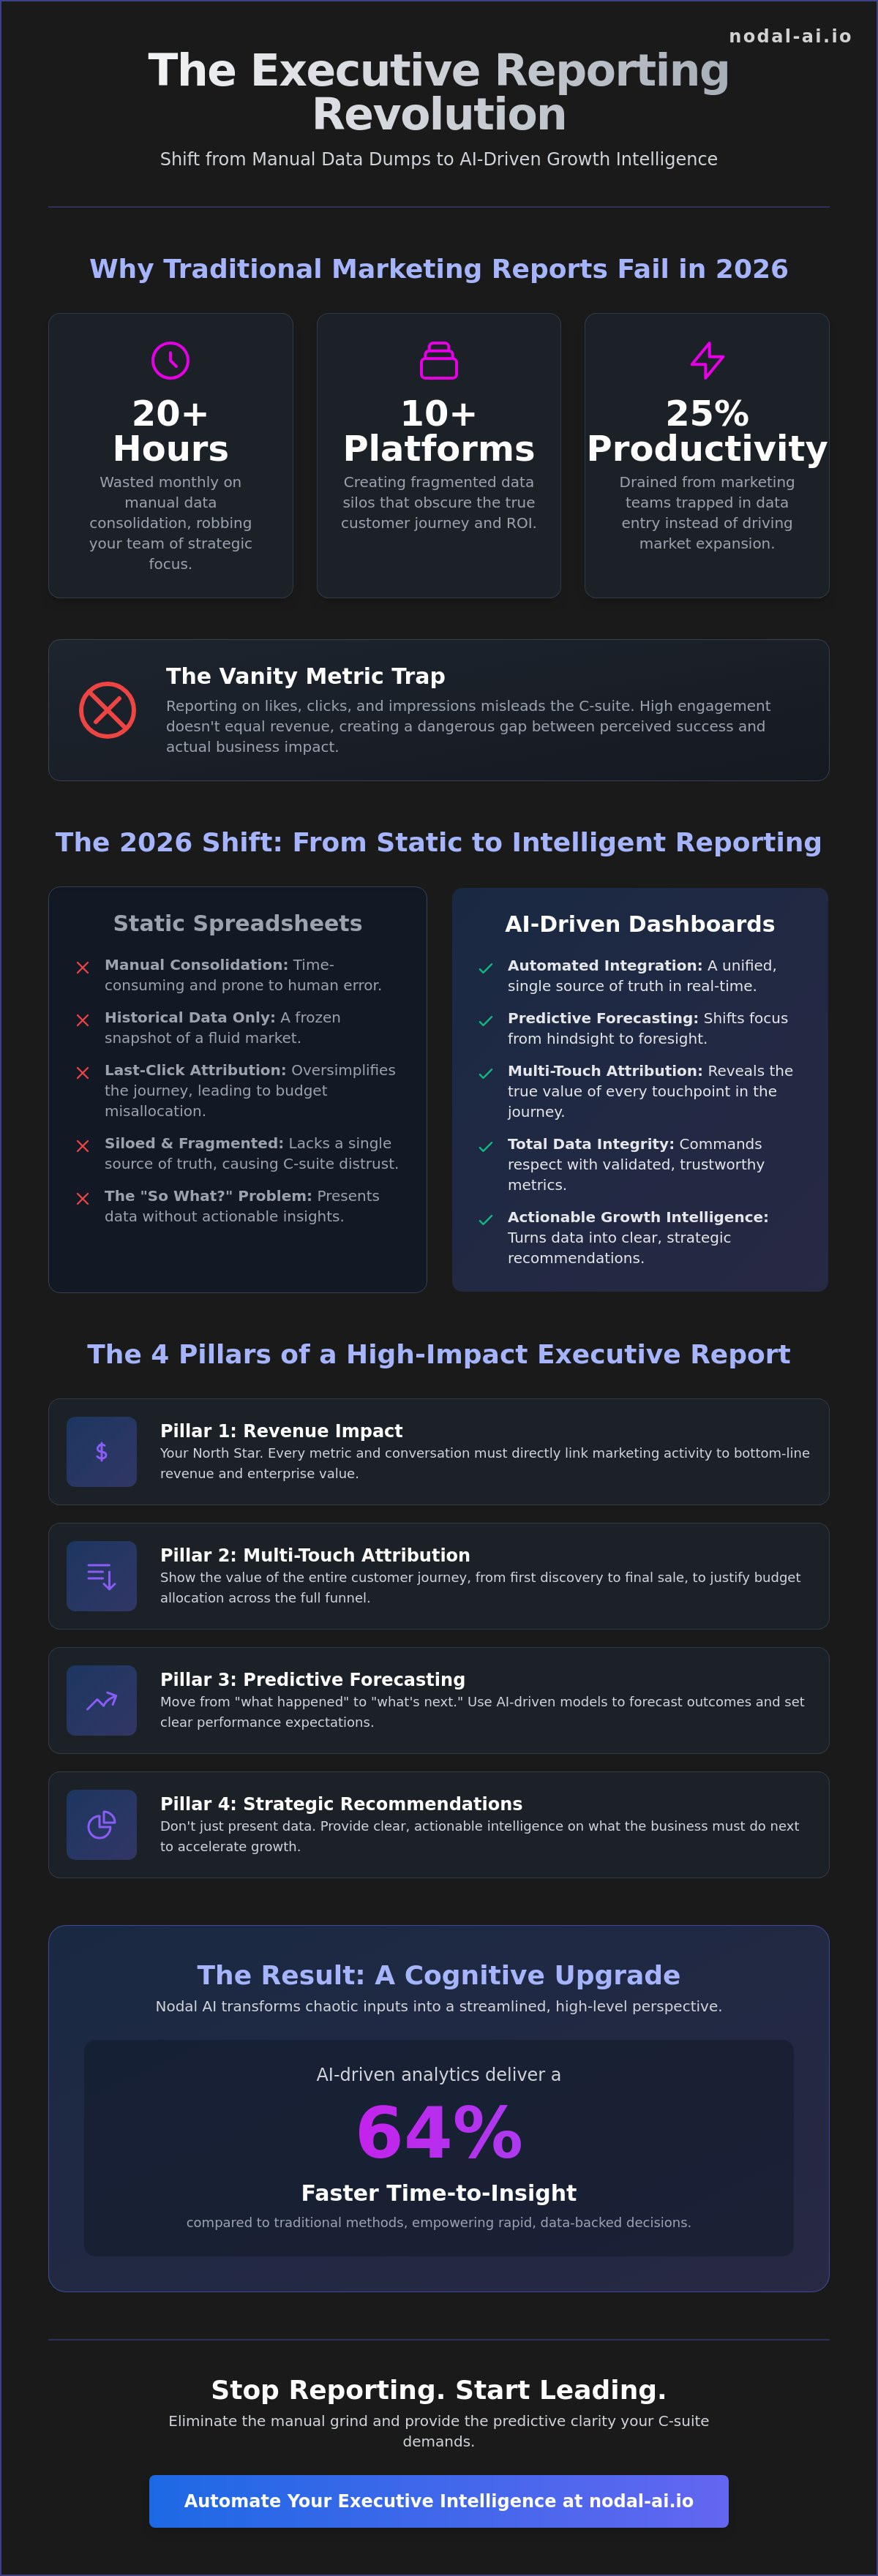
Marketing teams using AI-driven analytics report a 64% faster time-to-insight than those relying on traditional methods. If you're currently spending 20 or more hours every month manually consolidating fragmented data across 10 different platforms, you're not just losing time; you're losing authority. It's frustrating when the C-suite questions the validity of your attribution while you're still struggling to justify last month's spend. You need a reporting structure that commands respect and provides total clarity.
This guide introduces a modern marketing performance report template for executives designed for the 2026 strategic landscape. We'll show you how to shift from reporting basic historical data to presenting high-value growth intelligence that links marketing spend directly to revenue. You'll learn to use the Nodal Platform to automate insights, eliminate the "so what?" questions from your CEO, and gain predictive clarity on next month's performance. It's time to turn your chaotic inputs into a cognitive upgrade for your entire organization and replace manual labor with streamlined, high-level perspectives.
Key Takeaways
- Replace the "Vanity Metric Trap" with a focus on revenue impact to align your marketing narrative with C-suite expectations.
- Utilize a modern marketing performance report template for executives that unifies fragmented platforms into a single source of truth.
- Eliminate the 20-hour manual data grind by shifting from static spreadsheets to automated, multi-touch attribution frameworks.
- Master a two-step blueprint for executive summaries that provides predictive clarity on next month's performance.
- Transform passive data into active growth intelligence using the Nodal Platform to ensure total transparency and data integrity.
Why Traditional Marketing Report Templates Fail Executives in 2026
A marketing performance report template for executives that focuses on vanity metrics is a strategic liability. Your CEO doesn't care about impressions, likes, or click-through rates; they care about how marketing activities translate into enterprise value. In 2026, the gap between "marketing activity" and "business outcome" has widened due to fragmented data across 10 or more platforms. When you present siloed reports, you risk miscalculating ROI and losing the trust of the C-suite. High-level leadership requires a cognitive upgrade, moving from historical data dumps to predictive growth intelligence.
Static templates are obsolete the moment you export them to a PDF. They represent a frozen snapshot of a fluid market, failing to account for real-time shifts in consumer behavior or algorithmic changes. Relying on legacy frameworks often leads to the "Vanity Metric Trap," where teams celebrate high engagement while revenue remains stagnant. To bridge this gap, understanding marketing effectiveness is critical. It requires a shift toward measuring Return on Marketing Investment (ROMI) through integrated systems rather than isolated spreadsheets. Last-click attribution is dead; it ignores the complex, multi-touch reality of the 2026 customer journey.
The Information Overload Problem
Most executives have exactly five minutes to digest your report. If you spend four of those minutes defining technical jargon or explaining channel-specific nuances, you've failed to provide value. The modern professional is overwhelmed by chaotic inputs. They need you to resolve that complexity, shifting the conversation from "What happened last month?" to "What do we do now to accelerate growth?" Research shows that manual data consolidation and reporting drain 25% of a marketing team's productivity. This loss of efficiency prevents your best talent from performing high-value analysis, keeping them trapped in the mechanics of data entry instead of the strategy of market expansion.
The Attribution Deficit
Relying on simple, channel-specific reporting in 2026 is a recipe for budget misallocation. Without a unified view of the customer journey, you might overfund a high-converting "last-click" channel while accidentally cutting the top-of-funnel programs that actually fed the pipeline. This fragmented approach hides the true weight of your marketing assets. Fragmented data acts as a veil, obscuring the true cost of customer acquisition by failing to account for the complex, multi-touch interactions that drive modern conversions. To protect your budget and your reputation, you must adopt a marketing performance report template for executives that utilizes multi-touch attribution and predictive modeling to show the full picture of commercial impact.
The 4 Pillars of a High-Impact Executive Performance Report
Stop reporting on activity and start reporting on impact. A high-impact marketing performance report template for executives must do more than just aggregate data; it must provide a cognitive upgrade for the entire organization. Most templates fail because they focus on "faster wrong data" rather than intelligent insights. To secure executive trust, your framework must stand on four foundational pillars that bridge the gap between marketing spend and financial stability.
- Pillar 1: Revenue Impact. This is your North Star. Every conversation with the C-suite should begin and end with how marketing activities are fueling the bottom line.
- Pillar 2: Multi-Touch Attribution. Stop oversimplifying the customer journey. You need to show the value of every touchpoint, from the first discovery to the final sale.
- Pillar 3: Predictive Forecasting. Shift your focus from hindsight to foresight. Use data to model future outcomes and set realistic expectations for next month's performance.
- Pillar 4: Strategic Growth Recommendations. Don't just present numbers. Tell the CEO exactly what those numbers mean and what specific actions the business should take next.
Pillar 1 & 2: Linking Marketing to the Bottom Line
Connecting marketing spend to revenue requires a rigorous approach to data integration. When developing your reporting framework, adopting strategies for measuring marketing effectiveness ensures you're tracking KPIs that actually move the needle at different stages of the funnel. You must calculate Customer Acquisition Cost (CAC) across the full journey, not just for isolated campaigns. This transparency allows you to define "Incremental Growth" as the additional revenue generated specifically because of your marketing efforts, rather than organic sales that would've happened anyway.
Executive-level clarity demands that you justify top-of-funnel spend. Use marketing attribution to prove how early awareness campaigns feed the pipeline. This removes the ambiguity of "last-click" models and protects your budget from unnecessary cuts. If you're looking to unify these disparate sources, the Nodal Platform provides the integrated perspective needed to link every dollar spent to a concrete business outcome.
Pillar 3 & 4: From Hindsight to Foresight
Reporting historical data is only half the job. The real value lies in moving beyond what happened to predicting what will happen. Implementing predictive modelling allows you to transform fragmented data into future growth projections. This allows the CEO to see next quarter's potential with clarity, reducing the anxiety of market volatility. When you present your findings, structure your "Growth Recommendations" as business strategy. Instead of saying "we need more social ads," say "we should reallocate 15% of the budget to high-intent search to capture the projected 20% increase in demand."
Transparency is your greatest asset when discussing performance. Don't hide what didn't work. Identifying underperforming channels with the same rigor you use for winners builds immense executive trust. It shows you're obsessed with measurable returns and protecting the company's assets. This honest, high-level perspective turns your marketing performance report template for executives into a strategic narrative that drives decision-making at the highest levels.
Static Spreadsheets vs. AI-Driven Dashboards: A 2026 Comparison
The "free" Excel sheet is the most expensive tool in your marketing stack. While legacy frameworks suggest that static spreadsheets are the standard for tracking, they ignore the massive hidden labor cost. Manual data entry isn't just tedious; it's the primary enemy of executive trust. One misplaced decimal or a broken formula can invalidate an entire month of strategic planning. In a 2026 landscape where 56% of marketing teams have already adopted AI analytics, relying on a static marketing performance report template for executives is like using a paper map in a world of real-time GPS.
The Cost of Manual Data Consolidation
The "Reporting Tax" is a silent killer of productivity. When your team spends 20 or more hours every month wrestling with fragmented data across 10 different platforms, they aren't executing growth strategies. This manual labor creates a dangerous "Data Drift" where disconnected templates across different departments show conflicting results. By switching to automated reporting, you redirect that energy toward high-value execution. Integrating authoritative market research data into your automated flow ensures your internal metrics are always tethered to broader economic trends. This shift replaces the anxiety of manual errors with the confidence of unified, enterprise-ready systems.
- Instant Intelligence: Real-time dashboards provide a competitive advantage by allowing for immediate pivots, whereas monthly PDFs are historical artifacts.
- Data Integrity: Automated systems eliminate human error, ensuring that the C-suite never questions the validity of your numbers again.
- Resource Allocation: Teams using AI-driven analytics report a 64% faster time-to-insight, freeing up talent for creative and strategic tasks.
AI-Powered Insights: The Cognitive Upgrade
The transition from basic reporting to true intelligence is a career-defining move for marketing leaders. A 50-slide deck of historical charts doesn't impress a CEO; they want to know what the data predicts for the future. The Nodal Platform provides this cognitive upgrade by identifying patterns the human eye misses in a pivot table. Marketing teams using these advanced systems achieve 28-35% better forecast accuracy, allowing for more aggressive and confident budget conversations.
Predictive customer journey mapping changes the narrative from defensive justification to offensive planning. Instead of explaining why spend was high last month, you're presenting a data-backed roadmap for where the next 1,000 customers will come from. This real-time intelligence turns your marketing performance report template for executives into a living asset that orchestrates growth. It transforms your data from a passive record of the past into an active participant in your company's commercial future.
The Ultimate Executive Marketing Report Blueprint (Template Structure)
Stop drowning in endless slides. Start leading with clarity. A superior marketing performance report template for executives isn't a collection of charts; it's a strategic narrative that guides the C-suite toward a specific decision. By structuring your report as a logical journey from financial impact to future growth, you transform marketing from a cost center into a primary revenue driver. This blueprint replaces the "data dump" with high-level intelligence designed for 2026 market conditions.
Section 1: The Executive Summary
The first page of your report is the only one guaranteed to be read. Treat it as a one-page "Cheat Sheet" for the CEO. Limit this section to exactly four critical KPIs: Total Revenue, Customer Acquisition Cost (CAC), Return on Ad Spend (ROAS), and Pipeline Velocity. Use a "Traffic Light" system to provide instant context: Green for goals on track, Amber for metrics to watch, and Red for areas requiring immediate action. To summarize a complex quarter in 100 words, distill the narrative into three sentences: what we achieved against the primary revenue goal, the specific challenge that hindered greater progress, and the exact strategic pivot planned for the next 30 days.
Section 2-4: Deep Dive into Intelligence
Once you've established the high-level status, move into the "why" behind the numbers. Visualizing the customer journey is essential here. Instead of listing every touchpoint, group them into stages that show how awareness feeds the pipeline. This clarity allows you to link every marketing action to a concrete financial outcome. It removes the ambiguity that often plagues "last-click" reporting and replaces it with a transparent view of how budget is being converted into enterprise value.
Use your "Growth Recommendations" as a tool to secure more budget. Rather than asking for "more money for ads," frame your request as a business strategy: "By reallocating $50k from underperforming social channels to high-intent search, we project a 15% increase in pipeline velocity." This approach positions you as a capable partner who is deeply pragmatic and time-conscious. It shows that you've mastered future-facing analytics and are now inviting the executive team to benefit from that expertise.
- Step 2: Revenue & Pipeline Performance. Detail marketing's direct contribution to sales.
- Step 3: Attribution Breakdown. Identify the specific channels driving the journey.
- Step 4: Predictive Forecast. Show what will happen if current spend levels are maintained.
- Step 5: Resource Recommendations. Make the specific ask for the next period.
Transitioning from manual data entry to a structured, intelligent framework is the cognitive upgrade your organization needs. If you're ready to automate this entire process and eliminate the manual reporting tax, explore the Nodal Platform today.
Automating Executive Intelligence with Nodal AI
The transition from a static marketing performance report template for executives to an automated intelligence system is the final step in securing your seat at the boardroom table. While a well-structured template provides the framework, the Nodal Platform provides the engine. It transforms fragmented data from dozens of disconnected sources into a single, immutable source of truth. This shift eliminates the manual labor of data consolidation and allows your marketing assets to become active participants in your company's financial growth.
Moving beyond basic templates means embracing the power of automated, multi-touch attribution. In the 2026 landscape, where customer journeys are increasingly non-linear, relying on manual entry is a recipe for inaccuracy. Nodal AI finds the hidden opportunities that traditional pivot tables miss, offering real-time growth recommendations that allow you to pivot strategies instantly. You no longer need to spend weeks preparing for a quarterly review; the intelligence is always ready, empowering you to speak the language of the C-suite with absolute confidence.
The Nodal Advantage: Clarity over Complexity
For London-based marketing teams, the "Reporting Tax" is particularly heavy, often draining 20 or more hours every month. Our platform eliminates this burden, allowing your talent to move from "fixing data" to "driving decisions." Modern leaders are ditching static PDFs because they realize that a cognitive upgrade is required to stay competitive. By replacing manual workflows with streamlined, high-level perspectives, you replace the anxiety of tedious tasks with the calm efficiency of visionary leadership.
- Unified Data Systems: Stop jumping between 10 different platforms; see the entire journey in one place.
- Predictive Clarity: Use future-facing analytics to model budget outcomes before you spend a single pound.
- Transparent Governance: Ensure every data point complies with 2026 AI and privacy regulations automatically.
Next Steps: From Reporting to Growth
To begin this transformation, you must first audit your current process for "Executive Readiness." Ask yourself if your current marketing performance report template for executives answers the "so what?" questions from your CEO before they are even asked. Building a reporting culture focused on incrementality and ROI requires more than just new software; it requires a commitment to total transparency and measurable returns. When you link every marketing action to a financial outcome, you protect your budget and your reputation simultaneously.
It's time to stop looking backward and start looking ahead. Replace your manual spreadsheets with an intelligence engine that orchestrates growth. You've mastered the strategic framework; now, give your team the tools to execute it at scale. See how Nodal AI automates your executive reporting and transform your fragmented data into a profitable strategic asset today.
Master the Future of Executive Intelligence
The shift from a passive data dump to an active growth narrative is no longer optional. Legacy frameworks fail to bridge the gap between marketing spend and financial stability. By focusing on revenue impact and moving beyond vanity metrics, you transform your department into a respected revenue engine. Adopting a modern marketing performance report template for executives allows you to command the boardroom with predictive clarity and total transparency.
Don't let manual labor drain your team's productivity. You can eliminate 20+ hours of manual reporting every month while identifying hidden revenue through advanced multi-touch attribution. Trusted by leading UK marketing teams, the Nodal Platform turns chaotic inputs into high-value strategic outputs. It's time to replace the anxiety of fragmented data with the confidence of streamlined perspectives. Book a demo to see how Nodal AI automates your executive reporting. Your journey toward enterprise-ready intelligence starts now. Lead with the authority you've earned.
Frequently Asked Questions
What are the most important KPIs to include in an executive marketing report?
Focus on metrics that link marketing spend directly to financial stability. You should prioritize Total Revenue, Customer Acquisition Cost (CAC), Return on Ad Spend (ROAS), and Pipeline Velocity. These indicators provide the C-suite with a high-level perspective on how marketing activities fuel the bottom line. Avoid vanity metrics like impressions or clicks. They only create noise and distract from the true commercial impact of your team's efforts.
How often should a marketing performance report be presented to executives?
Present a strategic narrative once per month to align on long-term growth objectives. While real-time dashboards offer instant intelligence for operational teams, executives need a monthly cadence to digest high-value outputs without being overwhelmed by daily volatility. This frequency allows you to identify meaningful trends and present growth recommendations that have enough data to be statistically significant. It balances the need for transparency with the executive's limited time.
Why is multi-touch attribution better than last-click for executive reporting?
Multi-touch attribution reveals the true weight of your entire customer journey. Last-click models often oversimplify the process, crediting only the final interaction and ignoring the top-of-funnel work that fed the pipeline. This creates a dangerous misallocation of budget. By using a marketing performance report template for executives built on multi-touch data, you justify the spend on awareness campaigns and prove their role in driving eventual revenue.
How can I automate my marketing reports without losing data accuracy?
Unify your fragmented data into a single source of truth through an integrated platform. Manual entry is the primary enemy of data integrity; it introduces human error that erodes executive trust. Automation replaces this chaos with a cognitive upgrade for your organization. By connecting your 10 or more platforms directly to an AI-driven engine, you ensure that every number is verified and every insight is tethered to concrete business outcomes.
What is the difference between a marketing dashboard and a performance report?
Dashboards are for monitoring; reports are for deciding. A dashboard provides real-time visibility into active campaigns, acting as a tactical tool for the marketing team. A performance report is a strategic narrative that transforms those inputs into high-value intelligence for leadership. While the dashboard shows what is happening, the report explains why it matters and what specific actions the business should take to accelerate growth next month.
How do I handle "bad news" or poor performance in an executive report?
Lead with transparency and a data-backed pivot plan. Identify the underperforming asset quickly and explain the root cause using multi-touch insights. Executives value honesty and pragmatic problem-solving over defensive justifications. By presenting a growth recommendation that reallocates budget from a red-light channel to a green-light opportunity, you demonstrate that you're a capable partner obsessed with measurable returns and asset protection.
Can AI really predict future marketing performance accurately?
Yes, AI-driven analytics achieve 28-35% better forecast accuracy than traditional manual methods. Traditional forecasting relies on historical averages that fail to account for complex market shifts. AI models analyze thousands of variables across the customer journey to provide predictive clarity on next month's performance. This allows you to move from defensive reporting to offensive planning. It gives the CEO the confidence of streamlined, high-level perspectives before the budget is even spent.
What is the best format for an executive marketing report in 2026?
The most effective format is an interactive, digital framework that prioritizes the executive summary. Your marketing performance report template for executives should start with a one-page "Cheat Sheet" of 3-5 KPIs followed by predictive modeling and strategic recommendations. Ditch the 50-slide PDF. Modern leaders need a streamlined experience that resolves complexity and highlights immediate value. It should feel like a conversational partner that guides them toward profitable decisions.


