

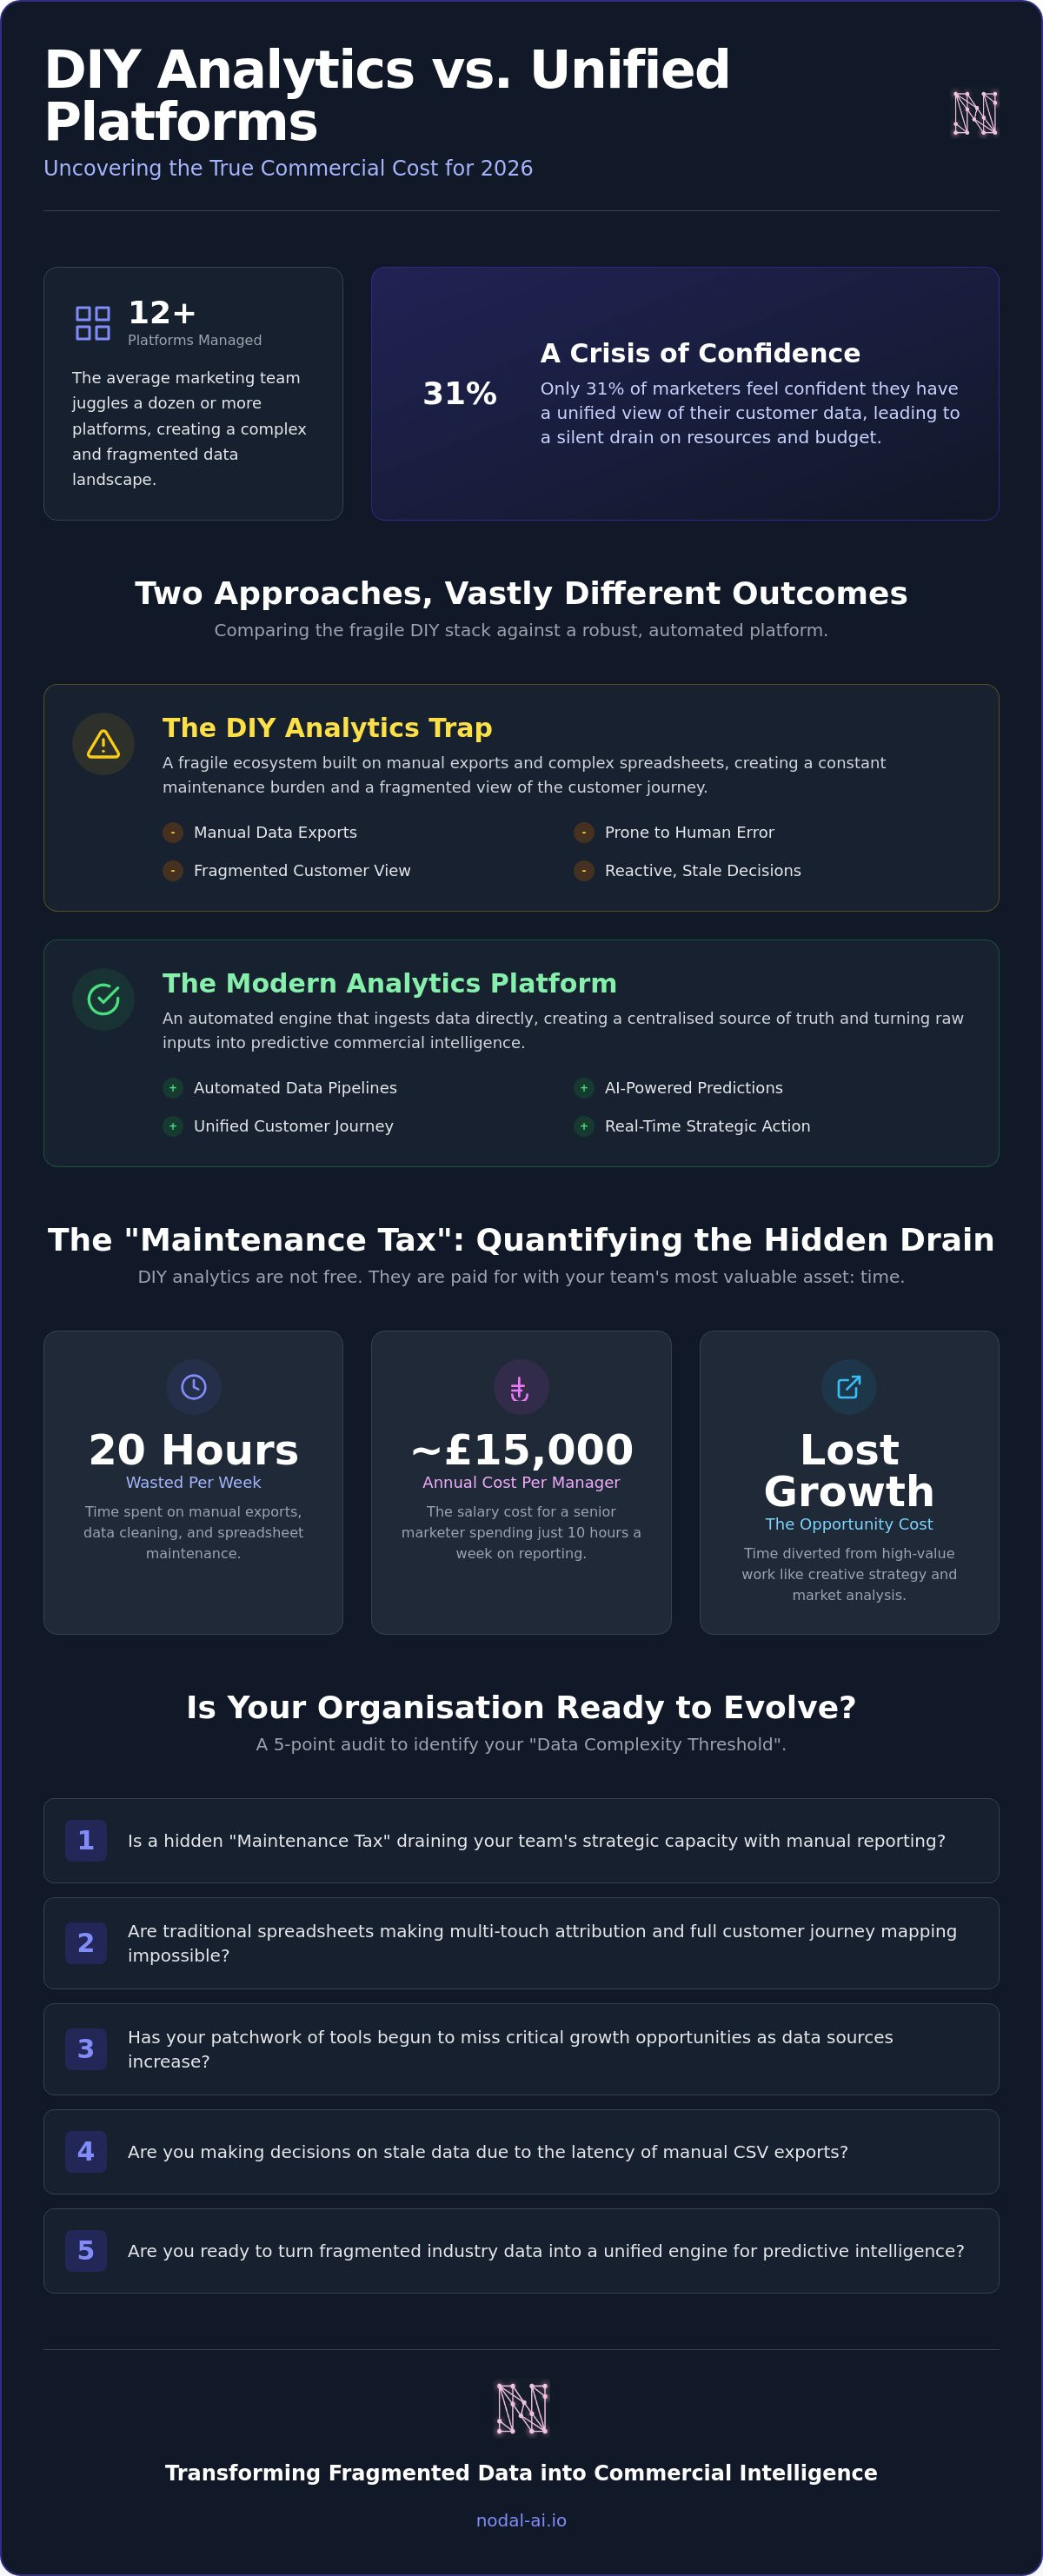
Did you know that while the average marketing team manages up to 12 different platforms, only 31 per cent of marketers feel confident they've actually unified their customer data? This disconnect creates a silent drain on your resources. When you weigh up diy marketing analytics vs analytics platform in 2026, the real cost isn't just the software subscription. It's the 20 hours your team wastes every week on manual data exports and the inaccurate attribution that burns through your ad budget.
You likely recognise the frustration of staring at fragmented spreadsheets that offer no clear path forward. It's time to replace that manual burden with the relief of automated, real-time reporting. This guide will show you how to move beyond basic tracking to secure a cognitive upgrade for your organisation. We'll explore the hidden financial leaks in manual setups and reveal how a unified analytics platform turns chaotic inputs into predictive growth recommendations. Discover how to reduce your cost per acquisition and reclaim your strategy time by choosing a system designed for the commercial demands of 2026.
Key Takeaways
- Quantify the "Maintenance Tax" to understand how manual reporting drains your team's strategic capacity.
- Use a 5-point audit to decide between diy marketing analytics vs analytics platform based on your organisation's current data complexity.
- Unlock multi-touch attribution and customer journey mapping capabilities that are impossible to execute within traditional spreadsheets.
- Identify the "Data Complexity Threshold" where your current patchwork of tools begins to miss critical growth opportunities.
- Discover how modular, automated systems can turn fragmented industry data into a unified engine for predictive commercial intelligence.
The DIY Marketing Analytics Trap vs The Modern Analytics Platform
Many marketing leaders fall into a comfortable trap: they believe their current reporting stack is free because it relies on tools they already own. They use Google Sheets for calculations, Zapier for basic connections, and manual GA4 exports for performance updates. In reality, this setup is a high-interest debt that consumes your team's most valuable asset: their time. When evaluating diy marketing analytics vs analytics platform in 2026, you must look past the initial software cost. You are choosing between a manual patchwork that requires constant maintenance and a unified engine that drives commercial intelligence.
To understand the stakes, we must first answer a fundamental question: What is Analytics? At its core, it is the discovery and communication of meaningful patterns in data. DIY methods focus heavily on the discovery through manual labour, often leaving no room for the communication or action that actually generates revenue. The primary goal of this comparison is to help you move from the tedious cycle of data collection to the high-value world of commercial action.
The components of a DIY marketing stack
A DIY setup typically resembles a fragile ecosystem held together by CSV exports and complex formulas. Your team spends hours pulling data from ad platforms and CRM systems, only to find that a single broken cell in a spreadsheet invalidates an entire week of reporting. This reliance on third-party connectors and manual inputs creates a fragmented view of the customer journey. You see the clicks and you see the conversions, but you cannot see the intricate path between them. It is a reactive approach that leaves you guessing while your competitors are executing.
The architecture of a modern analytics platform
A modern platform replaces manual toil with automated data pipelines and cloud-based processing engines. Instead of humans moving data, the system ingests information directly from your sources, creating a centralised source of truth for the entire organisation. This architecture ensures that every department looks at the same numbers in real-time. By using modular intelligence tailored to specific sectors, these platforms transform raw inputs into high-value outputs. You stop being a data entry clerk and start being a strategist. Explore the full range of Nodal Platform features to see how this transition works in practice. Reclaim your strategic capacity and turn your data into an active participant in your business growth.
Calculating the Hidden Costs of Building and Maintaining DIY Stacks
Building a custom analytics stack often starts as a cost-saving measure, yet it quickly evolves into a high-interest "Maintenance Tax." This tax is the financial burden of paying skilled staff to perform non-strategic, repetitive data tasks instead of driving growth. When you compare diy marketing analytics vs analytics platform in 2026, you must account for the hundreds of hours lost each year to broken formulas and manual synchronisation. While the process of tracking and analysing data is essential for modern business, the method you choose determines whether your data is an asset or a liability.
Data latency is another silent profit killer. In the fast-moving hospitality markets of today, relying on yesterday's CSV export means you are making decisions based on stale information. This delay leads to missed opportunities and inefficient budget allocation. As your business scales and you add more data sources, the technical debt of a DIY system multiplies. What worked for three sources becomes a nightmare for ten, creating a fragile infrastructure that is prone to human error and total failure. You eventually reach a breaking point where the cost of fixing the system exceeds the value it provides.
The opportunity cost of manual reporting
Consider the impact of a marketing manager in London spending 10 hours every week on manual reporting. Based on average senior salaries, this equates to roughly £15,000 per year spent simply moving numbers from one place to another. This is time that could be spent on creative strategy, brand planning, or high-level market analysis. Automated reporting eliminates this waste, allowing your best minds to focus on commercial outcomes rather than spreadsheet maintenance. You can see how automation reclaims your time by exploring unified platform solutions.
Data fragmentation and the cost of inaccuracy
Fragmented data creates "ghost" conversions and double-counting, where multiple platforms claim credit for the same sale. This inaccuracy directly erodes your Return on Ad Spend (ROAS) and leads to misinformed investment. When your attribution is flawed, you risk scaling the wrong campaigns and starving the ones that actually drive profit. A mere 5 per cent error margin in a multi-million pound ad budget results in six-figure sums of wasted capital that could have been reinvested in growth. Precision is no longer a luxury; it is a requirement for survival in a competitive landscape where every pound must be accounted for.
Technical Capabilities: Where Spreadsheets Fail and Platforms Excel
The gap between diy marketing analytics vs analytics platform capabilities is most evident when you attempt to map a modern customer journey. Spreadsheets are static. They capture a single moment in time but fail to account for the fluid movement of a customer across multiple touchpoints. While a manual stack might tell you which ad led to a final click, it ignores the five previous interactions that actually built the intent. This technical limitation results in a distorted view of reality, forcing you to make investment decisions based on incomplete evidence.
A modern platform bridges this gap by integrating external signals that spreadsheets simply cannot process at scale. Consider the impact of local tourism trends or sudden shifts in weather on your booking rates. A unified system ingests these variables automatically, providing a layer of context that manual reporting lacks. You stop looking at data in a vacuum and start seeing the external forces that drive your commercial performance.
Multi-touch attribution and the customer journey
Last-click models are the standard for DIY stacks simply because spreadsheets cannot handle the complexity of multi-touch attribution. These models consistently miscalculate true marketing ROI by over-valuing the final interaction and ignoring the top-of-funnel efforts that drive awareness. A unified platform tracks touchpoints across fragmented systems, connecting data from your Property Management System (PMS) directly to your Meta campaigns. This provides a granular view of how every pound spent contributes to the final booking. Read our Mastering Marketing Attribution guide to learn how to transition to this level of precision.
Predictive modelling vs historical snapshots
Spreadsheets are essentially rear-view mirrors; they show you what happened last month but offer no guidance for the next. Predictive modelling transforms your data from a historical record into a forward-looking GPS. By forecasting future performance based on historical trends, a platform identifies upcoming "need periods" before they occur. This allows your team to pivot strategy and launch targeted campaigns while there is still time to influence the outcome. You move from reporting on failure to engineering success.
Data governance and security
Shared spreadsheets are a security nightmare, often passed between personal accounts with little oversight. A dedicated SaaS platform provides a robust framework for data protection, ensuring that your commercial intelligence remains secure and accessible only to authorised users. This is particularly vital for UK-specific compliance, where the handling of guest data requires strict adherence to privacy standards. Implementing the Modern Data Governance Framework ensures your organisation moves from fragmented data to total strategic clarity without compromising security.
The Decision Framework: Is Your Organisation Ready to Graduate to a Platform?
Deciding when to transition from a manual setup is a pivotal commercial moment. It marks the shift from survival-based reporting to growth-oriented intelligence. When evaluating diy marketing analytics vs analytics platform models, the most critical factor is your Data Complexity Threshold. This is the point where the volume of incoming signals simply exceeds your team's capacity to process them accurately. If you find yourself questioning the validity of your spreadsheets every Monday morning, you've likely already crossed that line.
Many leaders hesitate because they fear a lengthy implementation. However, modern onboarding processes now focus on rapid ingestion, turning your historical data into actionable insights within weeks rather than months. You stop being a data entry clerk and start being a strategist. This transition is not just about new software; it is a cognitive upgrade for your entire organisation that rewards you with total clarity.
The 5-point DIY audit
Use this structured audit to diagnose the health of your current stack. This process helps you settle the diy marketing analytics vs analytics platform debate by highlighting the hidden friction in your current workflow:
- Audit the hours: Calculate the time spent on data cleaning versus actual analysis. If your team spends more than 20 per cent of their week fixing cells, your growth is being throttled by manual toil.
- Identify the blind spots: Look for gaps in your customer journey mapping. Can you see the direct path from a social media interaction to a final PMS booking?
- Evaluate response speed: Measure how long it takes to answer a commercial question. If finding out which channel drove direct bookings today takes more than five minutes, your data is too slow for 2026.
- Check for discrepancies: Compare your POS, CRM, and ad platforms. Mismatched numbers are a clear sign of a failing DIY stack that risks your budget.
- Assess scalability: Determine if your current system can handle a 50 per cent increase in data sources without breaking.
Evaluating integration requirements
Generic connectors often fail to capture the nuance of specialised hospitality data. You don't just need a link; you need deep industry integration with systems like Oracle OPERA or Mews. This level of connectivity allows you to see platform features that bridge the gap between guest behaviour and operational reality. By choosing a modular architecture, you ensure that your intelligence engine expands alongside your portfolio. You can start with operational modules and add demand or guest modules as your needs evolve.
Ready to move beyond the limitations of manual reporting? Book a demo of the Nodal Platform to see how unified intelligence can accelerate your growth and reclaim your team's time.
Nodal AI: Transforming Fragmented Hospitality Data into Commercial Intelligence
Nodal AI represents the final stage in the evolution from manual tracking to total commercial clarity. While generic business intelligence tools offer a broad view, they often lack the nuance required to navigate the specific complexities of the hospitality sector. By choosing the Nodal Platform, you are not just selecting a tool; you are implementing a cognitive upgrade for your entire organisation. This solution effectively ends the diy marketing analytics vs analytics platform debate by providing an industry-specific engine that removes ambiguity from every commercial decision.
The results of this transition are measurable and immediate. Businesses leveraging Nodal AI have realised a 15.3 per cent reduction in acquisition costs alongside a 24.5 per cent increase in Return on Ad Spend (ROAS). These are not just abstract improvements. They represent a fundamental shift in how capital is deployed, moving away from guesswork and toward precision-engineered growth. The modular architecture ensures that you only pay for what you need, whether you require operational, demand, or guest-focused intelligence.
Connecting the dots across hospitality performance
Disparate sources like your Property Management System (PMS), Point of Sale (POS), and digital ad platforms often exist in silos. Nodal unifies these passive assets, transforming them into active participants in your business strategy. This integration creates the "Z-view," a single, comprehensive view of the customer journey that a DIY stack simply cannot replicate. Beyond internal data, the platform ingests external signals such as flight demand and local event schedules. This allows you to understand the external forces shaping your booking patterns and adjust your strategy in real-time.
From raw data to growth recommendations
True intelligence goes beyond historical reporting to provide actionable growth recommendations. The AI-driven engine identifies high-propensity guest segments, allowing you to target individuals who are most likely to book direct. This proactive approach ensures you are always one step ahead of market shifts. Furthermore, the automated reporting features reclaim significant resources for your team, saving an average of 20 or more hours per month. Instead of spending their weeks exporting spreadsheets, your marketers can focus on high-level strategy and creative execution. We invite you to book a demo today to see your own fragmented data transformed into a unified engine for commercial success.
Secure Your Commercial Future in 2026
The choice between diy marketing analytics vs analytics platform is ultimately a decision between managing technical debt and driving sustainable growth. Manual reporting is no longer a viable strategy for hospitality leaders who require precision in a fast-moving market. By transitioning to a unified system, you replace the anxiety of fragmented data with the confidence of automated reporting and predictive intelligence. This shift is not just a technical upgrade; it is a fundamental change in how your organisation identifies and captures revenue.
Our modular architecture is designed specifically for the hospitality sector, ensuring your intelligence engine evolves alongside your business. Organisations that graduate to the Nodal Platform realise an average 15.3 per cent reduction in acquisition costs while saving 20 or more hours of strategic time every single week. It is time to stop being a data entry clerk and start being a visionary strategist.
Book a Nodal AI Demo to see your fragmented data transformed into commercial intelligence
Take the first step toward total clarity and turn your data into your most competitive asset today.
Frequently Asked Questions
What is the main difference between DIY marketing analytics and an analytics platform?
The primary distinction lies in the transition from manual labour to automated intelligence. DIY marketing analytics relies on a patchwork of CSV exports, fragile spreadsheets, and manual data entry that consumes your team's strategic time. An analytics platform acts as a unified engine that ingests data automatically, providing a real-time source of truth and predictive insights without the need for constant human intervention.
How much does a marketing analytics platform typically cost compared to a DIY setup?
While a DIY setup appears free because it uses existing tools like Google Sheets, it carries a heavy "Maintenance Tax" in staff hours. When you calculate the senior salary costs of spending 20 hours a week on reporting, the DIY model often proves more expensive than a platform subscription. A professional platform replaces these hidden costs with a transparent investment that reclaims your team's most valuable asset: their time.
Can a small marketing team manage a professional analytics platform without a data scientist?
Is it difficult to integrate my current hospitality systems with Nodal AI?
Integrating your existing tech stack is a streamlined process designed for rapid deployment. Unlike generic tools, Nodal AI is built with deep industry integrations for systems such as Oracle OPERA and Mews. This specialised architecture ensures that your operational and marketing data are connected quickly, turning your historical information into actionable commercial intelligence within weeks of onboarding.
How long does it take to see a return on investment after switching from DIY to a platform?
Most organisations realise an immediate return through the relief of automated reporting, which saves an average of 20 hours per month. The financial impact of the diy marketing analytics vs analytics platform shift typically becomes visible within the first quarter. As the system identifies high-propensity guest segments and optimises attribution, you can expect to see a measurable reduction in acquisition costs and improved campaign performance.
Will an analytics platform help me comply with GDPR and UK data privacy laws?
A professional platform provides a robust security framework that far exceeds the protection offered by shared spreadsheets. These systems are built to adhere to strict UK data privacy standards, ensuring your guest information is handled with high-level security. By centralising your data within a secure SaaS environment, you remove the risks associated with manual data handling and decentralised storage.
Can I still use Excel alongside an analytics platform for ad-hoc reporting?
You can certainly continue using Excel for specific, creative data exploration. In this new workflow, the platform serves as your primary source of truth and storage, while Excel becomes a tool for ad-hoc tasks rather than the foundation of your reporting. This transformation ensures that any manual analysis you perform is based on clean, unified data rather than fragmented exports.
What specific hospitality data sources can Nodal AI integrate?
The Nodal Platform unifies a comprehensive range of industry-specific sources to provide total clarity. This includes Property Management Systems (PMS) like Mews and Oracle OPERA, various Point of Sale (POS) systems, and digital ad platforms such as Meta and Google. The engine also ingests external signals, including flight demand and local event data, to ensure your diy marketing analytics vs analytics platform comparison accounts for every variable driving your performance.


