

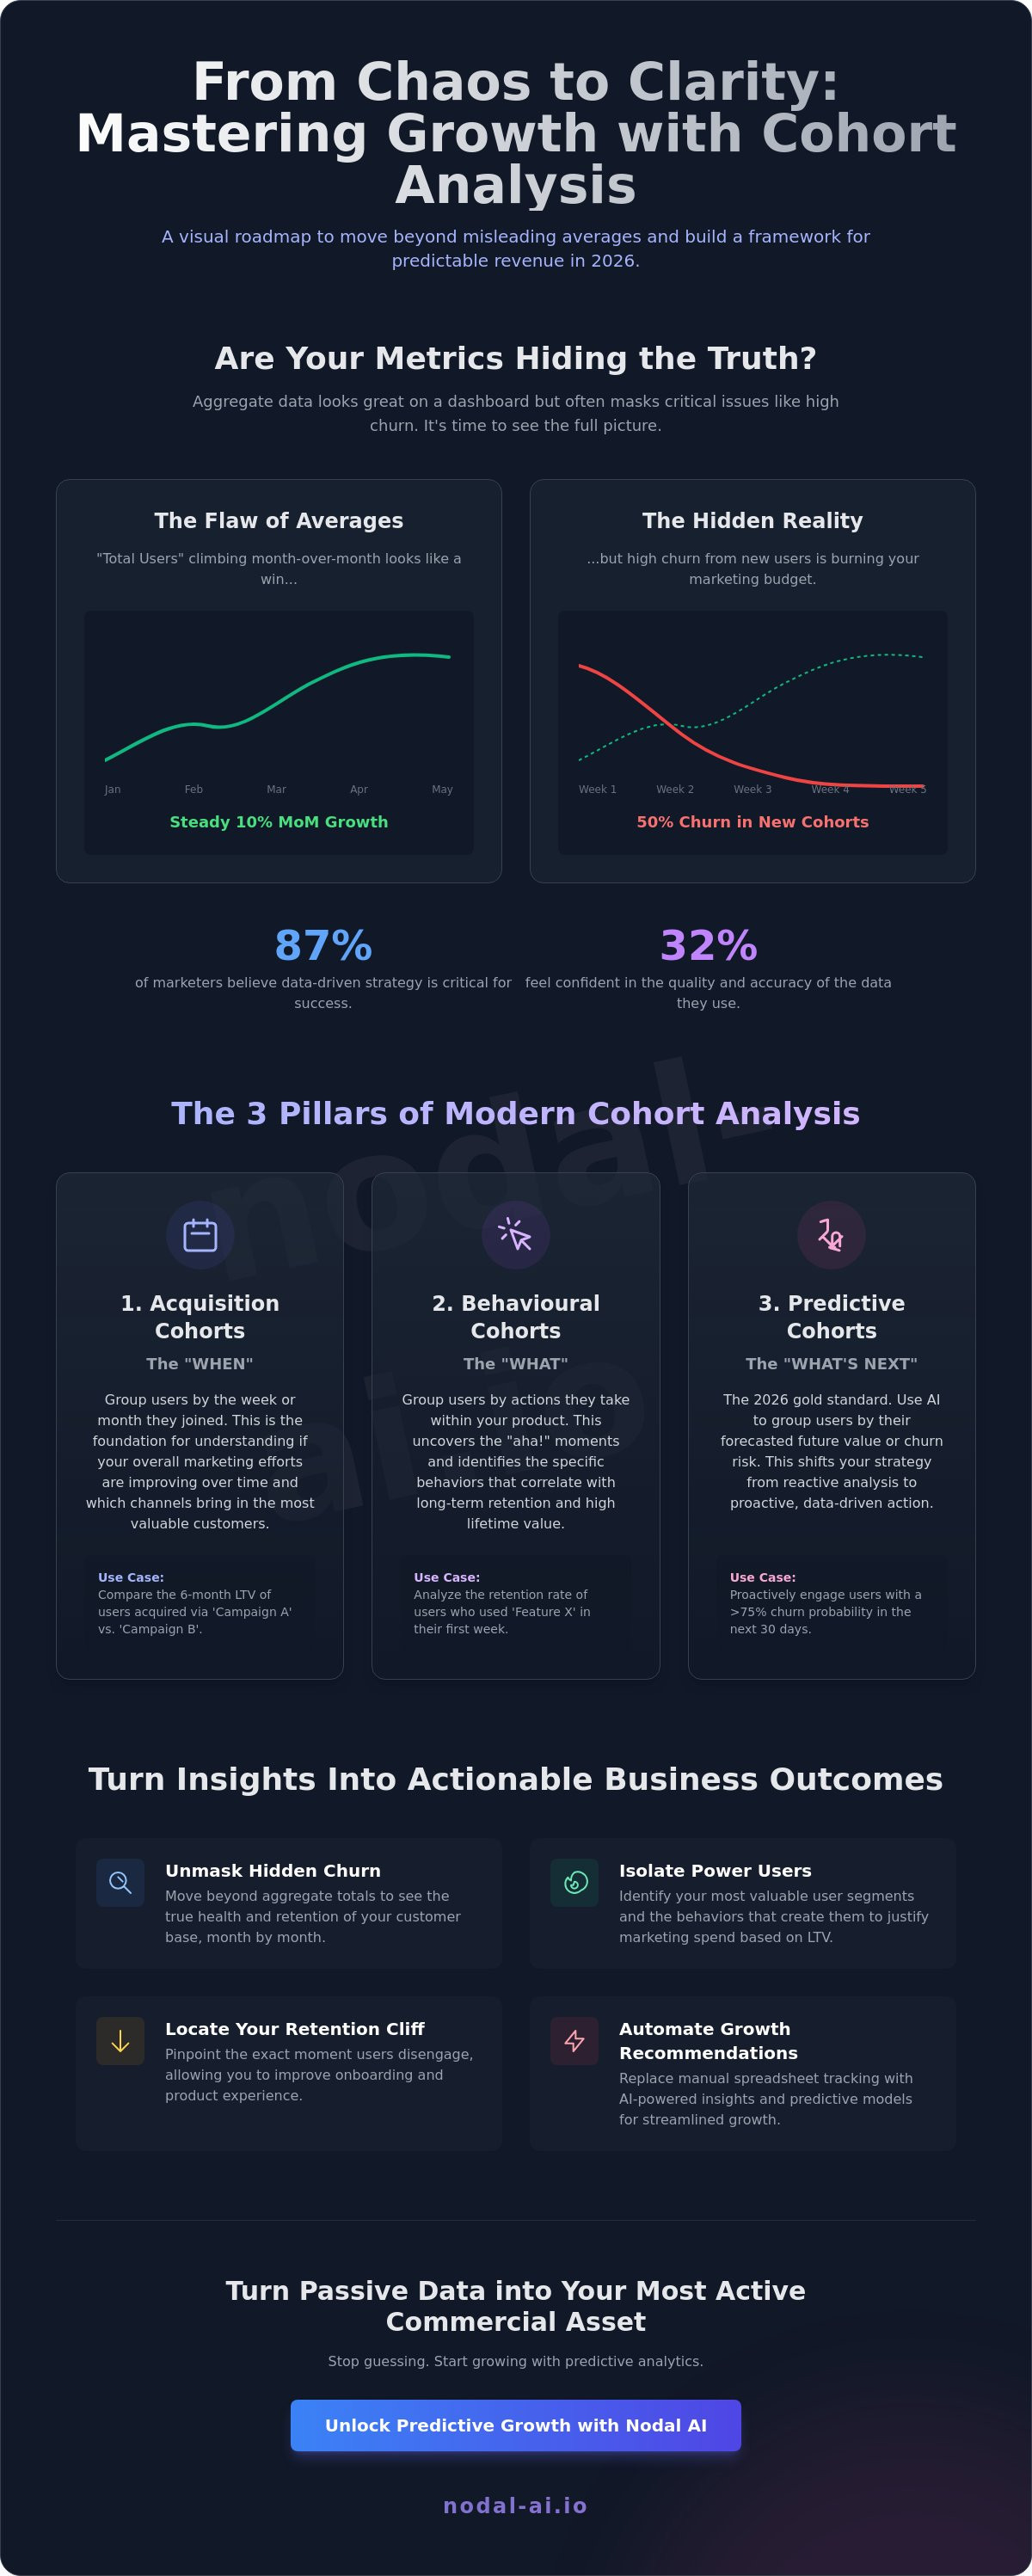
87% of marketers believe data-driven marketing is critical, yet only 32% feel confident in the quality of the data they see. It's a common trap; you watch total user counts climb while high churn rates remain hidden in the shadows. Fragmented data across channels makes it nearly impossible to tell if your current acquisition strategies are truly more profitable than last year's efforts. You deserve a clearer perspective on your performance and the relief that comes from resolving this complexity.
This guide shows you how to use cohort analysis to transform chaotic inputs into high-value revenue outputs. Learn to move beyond surface-level averages and build a precise framework for grouping users based on real behavior. We'll explore how to use predictive modelling to forecast future revenue and leverage multi-touch attribution to justify your marketing spend based on true lifetime value. It's time to replace the anxiety of manual tracking with the confidence of streamlined, high-level analytics. This is your roadmap to predictable growth in 2026, turning passive data into your most active commercial asset.
Key Takeaways
- Unmask hidden churn by moving beyond aggregate totals to reveal the true health of your customer base.
- Build a structured cohort analysis framework that groups users by acquisition timing, specific behaviors, and predictive potential.
- Locate your retention cliff and isolate power users to justify marketing spend based on actual lifetime value.
- Replace manual tracking with automated growth recommendations powered by intelligent predictive modelling.
Beyond Average Metrics: Why Cohort Analysis is Essential for 2026 Marketing
Averages are the silent killers of marketing budgets. On a standard dashboard, a steady 10% month-over-month growth rate looks like a victory. In reality, that single number can easily hide a 50% churn problem among your most recent sign-ups. This is the "Flaw of Averages," where aggregate data smooths over the cracks in your strategy. To find the truth, you must understand what is cohort analysis: the practice of tracking specific groups of users over time rather than staring at a monolithic total.
Traditional reporting treats your database like a single, stagnant pool. Cohort analysis treats it like a series of distinct waves. Each cohort is defined by time-bound shared characteristics, usually the date of their first transaction or account creation. By isolating these groups, you see exactly how the "January 2026" group behaves differently from the "February 2026" group. This level of clarity replaces the anxiety of guesswork with the confidence of hard evidence, allowing you to see which acquisition strategies are actually gaining momentum.
The End of Vanity Metrics in Performance Marketing
Relying on "Total Users" is a dangerous gamble for London-based growth teams in 2026. With 87% of marketers admitting data-driven strategy is critical but only 32% trusting their data quality (Digital Applied, 2026), vanity metrics are no longer enough to survive. High-level totals tell you that people arrived; cohorts tell you if they stayed. This shift reveals the true health of your customer acquisition cost (CAC). If a specific channel brings in thousands of users who all vanish by week three, your CAC isn't just high; it's wasted. Transform your fragmented data into unified lifecycle intelligence to ensure every pound spent builds a foundation for revenue.
Connecting Cohorts to Business Outcomes
Profitability lives in the long tail of customer retention. You can't scale what you can't measure, and you can't measure long-term value through a single-point-in-time report. Use cohorts to validate your performance analytics across different channels. This approach allows you to see which campaigns produce "flash-in-the-pan" users versus those that deliver high-LTV loyalists. When you identify which group has the highest return on ad spend after six months, you aren't just reporting on the past. You're building a roadmap for the future. Professional cohort analysis is a cognitive upgrade for your marketing reporting that turns passive data points into active participants in your growth strategy.
The Three Pillars of Modern Cohorts: Acquisition, Behavioural, and Predictive
To master growth, you must look beyond the calendar. While the previous section established why aggregate averages fail, effective execution requires you to categorize users through three distinct lenses. Modern marketing teams no longer settle for flat, historical reports. Instead, they use acquisition, behavioural, and predictive pillars to turn silent data into actionable intelligence. This structured approach to cohort analysis ensures that every customer segment is treated as a unique revenue engine rather than a generic statistic.
Acquisition cohorts remain the classic baseline. You group users by the specific week or month they joined your platform. This tells you if your January intake is more valuable than your February group. It's the first step in identifying whether your overarching strategy is improving over time. Behavioural cohorts shift the focus from "when" to "what." You group users based on specific actions, such as interacting with a high-value feature or clicking a specific retargeting ad. This provides a Beginner's Guide to Reducing Churn by highlighting which specific actions correlate with long-term loyalty. Finally, predictive cohorts represent the 2026 gold standard. Here, you group users by their likely future value or churn risk. It's no longer just about what they did; it's about what they'll do next.
Acquisition vs. Behavioural: Choosing Your Starting Point
Use acquisition cohorts to test the initial strength of new marketing channels. They provide the raw data needed to calculate early payback periods and baseline retention. However, behavioural cohorts are the secret to understanding content marketing roi. By tracking users who consume specific whitepapers or webinars, you can see if those educational touchpoints lead to higher lifetime value. Combine both pillars to see if specific onboarding behaviours shorten the time it takes for a new acquisition to become profitable. This provides the relief of knowing exactly where your spend is working.
The Rise of Predictive Cohorts in 2026
Predictive cohorts use AI to group users by their probability of churning before it actually happens. This shift from historical reporting to forward-looking intelligence is transformative. Sophisticated predictive modelling allows you to reallocate ad spend in real-time. Instead of wasting budget on users likely to leave, you can double down on segments with the highest growth potential. Transition your strategy from looking in the rearview mirror to receiving real-time growth recommendations. You can explore how the Nodal platform automates this transition, moving your team from reactive data entry to proactive revenue management.
How to Conduct a Cohort Analysis: A Step-by-Step Implementation Guide
Stop guessing and start measuring. Execution begins with a single, sharp growth question. You might ask if your high-spend January campaign is still generating returns four months later. To answer this, you must define two critical points: your Inclusion Event and your Return Event. The Inclusion Event marks the user's entry into the cohort, such as a first purchase or account creation. The Return Event is the specific action you're tracking to measure success, like a subscription renewal or a second order.
Next, select your time grain. Daily analysis works for high-frequency apps, but monthly grains are usually better for B2B sales cycles. Once you have these parameters, gather your data from fragmented silos into a unified analytics engine. Visualise the output using a 'Layer Cake' chart to see cumulative growth or a standard retention table to spot drop-off points. This structured approach to cohort analysis replaces chaos with clarity, allowing you to see the real impact of your marketing efforts.
Step 1: Defining Your Success Metrics
Choose your primary metric based on your business model. Revenue-based cohorts track financial stability, while engagement-based cohorts measure product stickiness. Align these events with your customer journey stages to see where users lose momentum. Implementing strict data governance at this stage is vital. If your inputs are fragmented or inaccurate, your results will be misleading. High-quality data is the only foundation for reliable growth recommendations.
Step 2: Segmenting and Visualising the Data
Master the cohort triangle table. Each row represents a specific cohort, while the columns track their behaviour over subsequent time periods. Always establish a 'Day 0' baseline to represent 100% of the group. This baseline allows you to calculate true retention rates as users move through the lifecycle. A diagonal pattern in your data suggests a platform-wide issue. This visual cue shows that a specific event, like a server outage or a bug, affected all cohorts simultaneously regardless of when they joined. By isolating these patterns, you turn raw data into a clear roadmap for optimization. This level of cohort analysis ensures you're never blindsided by hidden platform failures.
Reading the Results: How to Identify Revenue Levers in Your Cohort Tables
Data tables are only as valuable as the decisions they trigger. When you perform a cohort analysis, you're hunting for the "Retention Cliff." This is the sharp drop-off point where users typically stop engaging. By pinpointing exactly when this happens, you can stop the bleeding with automated re-engagement triggers. This level of clarity replaces the anxiety of guessing with the relief of a clear, actionable roadmap for your growth team.
Spotting your "Power Users" is the ultimate revenue lever. You must identify which acquisition groups deliver the highest what is roas over a sustained six-month period. This insight allows you to justify a higher CAC for high-value segments, moving your strategy from simple volume to high-margin growth. It's about recognizing that a user who costs more to acquire but stays for years is infinitely more valuable than a "cheap" user who churns in days.
Watch for the "Smile Curve." This phenomenon occurs when older cohorts re-engage after a period of inactivity, indicating that your long-term retention strategies are paying off. It suggests that your database is an active participant in your growth, not just a list of historical transactions. When your cohort analysis reveals this curve, it's a signal to double down on the lifecycle campaigns that are pulling users back into the fold.
Diagnosing Drop-offs and Churn
Stop wasting budget on preventable churn. Distinguish between users who were never a fit and those who encountered friction in your journey. If a specific marketing channel consistently yields "low-quality" cohorts, reallocate that capital elsewhere. Use these insights to fuel automated re-engagement campaigns that target users before they fall off the cliff. Identifying these patterns early allows you to protect your assets and maintain a high-level perspective on account health.
Optimising for Lifetime Value (LTV)
Calculate the "Payback Period" for every acquisition group to understand your true liquidity. Shift your spend toward cohorts that exhibit "sticky" behaviours, such as frequent feature usage or early repeat purchases. This transition from intuition to data-driven decision making is what separates market leaders from those chasing vanity metrics. You can gain this level of clarity instantly with Nodal's Performance Marketing Analytics, which turns fragmented data into a predictive engine for revenue.
From Hindsight to Foresight: Leveraging AI-Driven Predictive Cohorts with Nodal
Manual data mapping is a drain on your most valuable asset: time. While previous sections detailed the strategic value of cohort analysis, the reality of manual tracking often involves fragmented spreadsheets and inconsistent data sources. Nodal AI eliminates this friction. It automates the complex task of unifying disparate data streams into high-value intelligence. This transition from manual labor to automated reporting allows you to move beyond historical tables. Instead of looking at what happened last quarter, you receive real-time growth recommendations that shape your next move.
Our multi-touch attribution engine acts as the primary fuel for these insights. By resolving the touchpoints across the entire customer journey, Nodal creates more accurate behavioural cohorts. This isn't just about organizing data; it's about turning passive metrics into active participants in your business strategy. Nodal positions itself as the partner that transforms chaotic inputs into a clear, predictive roadmap for revenue. This is a cognitive upgrade for your entire organization, replacing tedious tasks with streamlined, high-level perspectives.
Automating the Complexity of Attribution
Marketing in 2026 requires navigating the 'Walled Garden' problem. Platforms like Google and Meta often hide the full picture, leading to fragmented cohorts that miss key touchpoints. Nodal resolves this by creating a unified view of the customer across all channels. You can save 20+ hours a week by eliminating manual spreadsheet-based cohort tracking. This shift grants you total clarity on which marketing levers actually drive long-term growth. It replaces the anxiety of data gaps with the confidence of an integrated, enterprise-ready system. You gain the power to justify every pound of spend with concrete evidence of future stability.
Your Next Step Toward Strategic Clarity
The old way of performing cohort analysis required waiting six months to see a group mature. Predictive AI changes the rules. By analyzing early behavioural signals, Nodal forecasts future value with high precision. This means you can optimize your spend today based on tomorrow's likely returns. It's the difference between reacting to the past and engineering the future. Don't wait for the data to catch up to your ambitions. See how our predictive modelling transforms fragmented metrics into profitable growth. Book a Nodal Platform demo to unlock your predictive growth.
Master Your Growth Roadmap for 2026
The era of relying on vanity metrics and fragmented spreadsheets is over. You've learned how to dismantle the "Flaw of Averages" by implementing a professional cohort analysis framework that isolates true revenue drivers. By moving through the three pillars of acquisition, behavior, and prediction, you transform silent data into a vocal participant in your business success. You now have the tools to identify your retention cliffs and double down on the power users who fuel long-term stability.
The transition from chaotic inputs to high-value outputs doesn't have to be a manual burden. You can replace the anxiety of data gaps with the confidence of streamlined, AI-driven perspectives. Leverage automated multi-touch attribution and predictive modelling to stay ahead of 2026's shifting markets. It's time to stop looking in the rearview mirror and start engineering your future with precision. This shift turns your reporting from a historical record into a forward-looking engine for profit.
Transform your fragmented data into actionable growth with the Nodal Platform and access real-time growth recommendations today. Your roadmap to predictable revenue is ready; now is the time to lead your organization with total clarity and confidence.
Frequently Asked Questions
What is the difference between cohort analysis and customer segmentation?
Segmentation groups users based on static attributes like location or job title. In contrast, cohort analysis groups users by a shared event within a specific time frame. This temporal element allows you to track behavior over time rather than viewing a frozen snapshot. It transforms a flat category into a dynamic lifecycle that reveals how user value evolves.
How many users do I need to perform a statistically significant cohort analysis?
Aim for a minimum of 100 to 200 users per cohort to identify reliable trends. While smaller groups show early signals, larger samples reduce the noise caused by individual outliers. If your traffic is lower, extend your time grain from weekly to monthly to gather enough data points. This ensures your growth recommendations are based on stable patterns rather than random fluctuations.
Can I perform cohort analysis in Google Analytics 4 (GA4)?
Yes, GA4 includes a "Cohort exploration" template within the Explorations menu. It allows you to define inclusion and return events based on standard dimensions. However, standard tools often struggle with the deep predictive modelling and automated multi-touch attribution required for high-level commercial optimization. For total clarity, you need a system that unifies fragmented data across all your marketing channels.
What is a 'behavioural cohort' and why should I care?
A behavioural cohort groups users by specific actions they took, such as completing a product tutorial or clicking a specific retargeting ad. You should care because these cohorts reveal which user actions correlate most strongly with long-term revenue. Identifying these patterns allows you to engineer your customer journey toward higher retention. It replaces the anxiety of guesswork with the confidence of data-driven strategy.
How does cohort analysis help in calculating Customer Lifetime Value (CLV)?
It provides the historical retention and revenue data needed to project future earnings for specific groups. By watching how a previous cohort matures over twelve months, you can accurately predict the lifetime value of a similar new group. This approach replaces intuition with a concrete financial roadmap. It allows you to justify higher acquisition spend for segments that prove to be more profitable over time.
What is the most common mistake when setting up a cohort table?
The most frequent error is failing to define a clear "Return Event" that aligns with actual business value. Marketers often track "App Opens" or "Logins" instead of "Purchases" or "Renewals." This leads to vanity metrics that hide a lack of real profitability. Ensure your events are tethered to concrete commercial outcomes to turn your cohort analysis into a true engine for growth.
How often should a marketing team review their cohort analysis reports?
Review your reports weekly to catch early signals and monthly for strategic budget reallocation. High-growth teams use automated reporting to monitor daily fluctuations in newer cohorts without the burden of manual labor. Regular reviews allow you to replace reactive fire-fighting with proactive optimization. This consistent rhythm ensures you remain competitive and obsessed with measurable returns in a fast-paced market.
Is cohort analysis only useful for SaaS businesses?
No, it is equally vital for e-commerce, retail, and any business with repeat transactions. Any organization focused on retention and lifetime value benefits from isolating groups to see how loyalty evolves over time. Whether you're tracking subscription renewals or repeat clothing purchases, these insights provide the relief of total clarity. It is a cognitive upgrade for any marketing team that values long-term stability over short-term spikes.


