

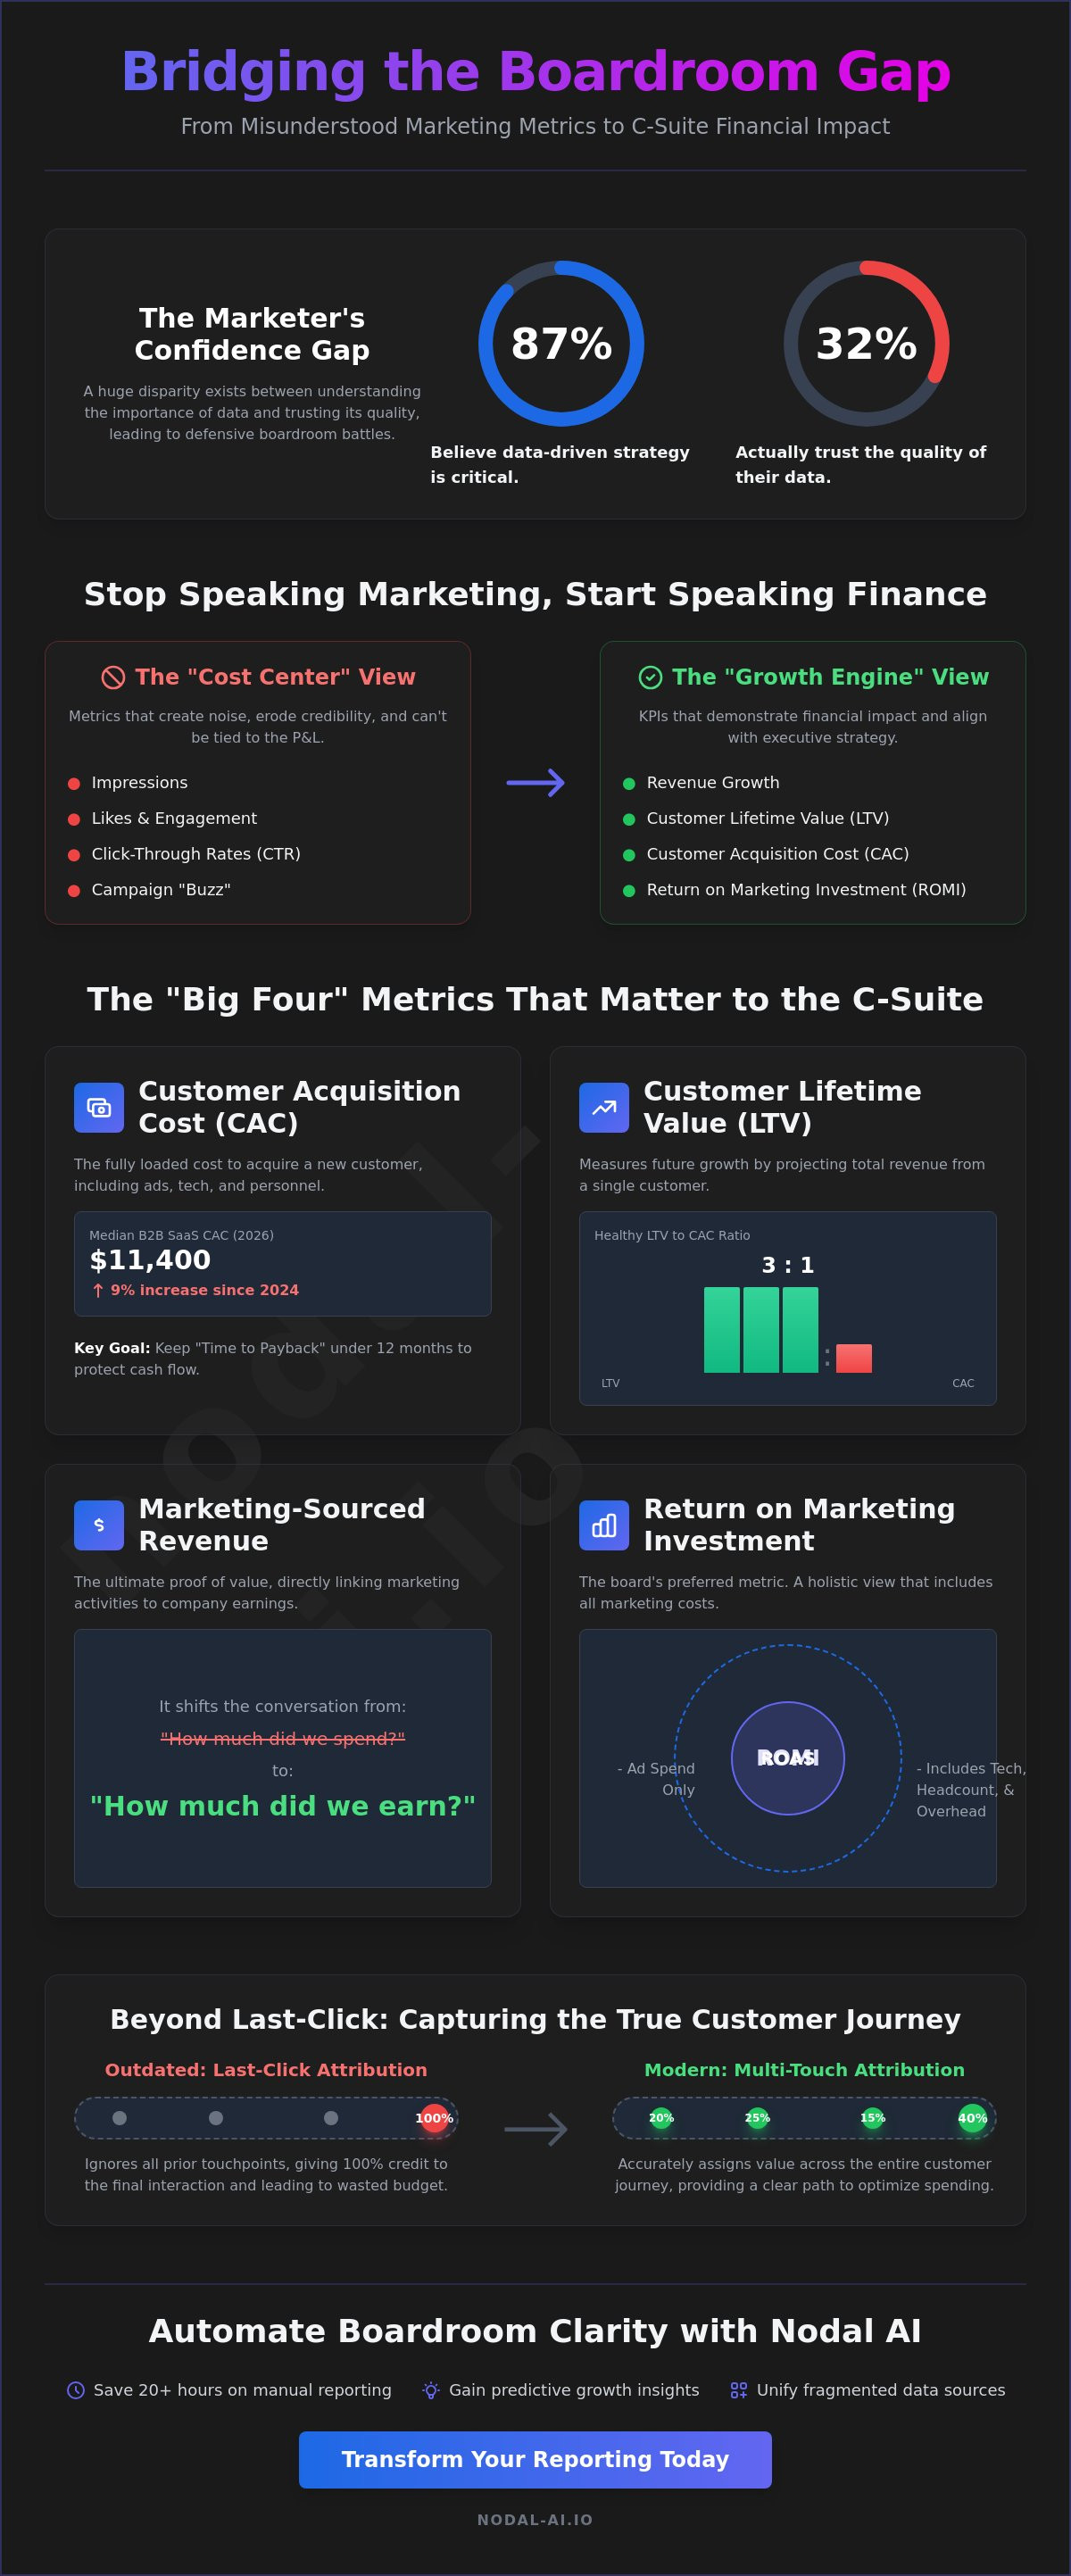
While 87% of marketers believe data-driven strategies are critical, only 32% actually trust the quality of their own data. This confidence gap turns every quarterly meeting into a defensive battle. You know the frustration of watching directors dismiss your hard-earned results as a cost center because the numbers don't speak their financial language. It's time to stop reporting on vanity metrics and start presenting marketing kpis to the board as strategic assets. You can bridge this gap by transforming fragmented inputs into high-value financial outputs that prove exactly how you drive revenue.
We agree that manual reporting is a drain on your productivity and your professional authority. This guide helps you master boardroom storytelling by replacing chaotic spreadsheets with sophisticated performance marketing analytics. You'll learn how to move beyond last-click metrics toward multi-touch attribution and predictive modelling that directors actually respect. We'll show you how to command the room with a clear customer journey map that justifies your budget and secures your seat at the table. Get ready to shift from reactive reporting to a future-facing narrative of predictive growth.
Key Takeaways
- Learn how to bridge the communication gap by presenting marketing kpis to the board as high-level financial drivers rather than operational costs.
- Identify the "Big Four" executive metrics, including CAC and LTV ratios, that align marketing performance with long-term commercial stability.
- Replace outdated last-click models with multi-touch attribution to accurately capture the customer journey and eliminate wasted budget.
- Structure your board deck to lead with revenue and profit, using data-driven storytelling to justify strategic budget allocation.
- Discover how the Nodal Platform automates reporting to save 20+ hours of manual preparation while delivering predictive growth insights.
The Boardroom Gap: Why Traditional Marketing Reports Fail to Resonate
The boardroom doesn't care about your latest campaign's "buzz"; they care about the bottom line. For too long, marketing has been trapped in a cycle of reporting activity rather than value. When you present a list of completed tasks, the board sees a cost center. When you present a list of revenue drivers, they see a growth engine. This friction exists because of a fundamental disconnect between marketing data and the CFO's ledger. If your reporting doesn't mirror the financial reality of the business, it's dismissed as noise.
Bridging this gap requires a psychological shift. You must move from explaining "what we did" to proving "what we generated." In 2026, 59% of CMOs report having an insufficient budget to execute their strategy. This lack of funding often stems from a failure to translate marketing effort into financial impact. Recent research shows that 75% of marketers report their current measurement systems fall short of providing the trust needed for effective decision-making. If your metrics don't align with the organization's overarching financial goals, your budget will always be the first to face the axe.
The Vanity Metric Trap
Impressions, likes, and click-through rates are banned in the 2026 boardroom. These "soft" data points are dangerous because they cannot be tied directly to the P&L. Reporting them erodes your credibility over time; it suggests you're more focused on digital noise than commercial success. Boards now demand transparency. They want to see how every dollar spent moves the needle on enterprise value. If a metric doesn't influence a financial decision, leave it out of your deck. Your goal is to turn chaotic inputs into high-value outputs that directors can actually use to steer the company.
Bridging the Language Barrier
Mastering the art of presenting marketing kpis to the board means learning to speak "Finance." Replace "Campaign Performance" with "Commercial Clarity." Instead of discussing social engagement, talk about EBIT impact and Revenue Growth. Your objective is to show how marketing assets are active participants in the business process. Align your KPIs with the organization's 2026 strategic goals by focusing on customer lifetime value and acquisition efficiency. Use this opportunity to position yourself as a visionary leader who understands the mechanics of growth. This transformation replaces the anxiety of manual reporting with the confidence of a streamlined, high-level perspective.
The Strategic KPI Framework: Metrics That Matter to the C-Suite
Success in presenting marketing kpis to the board relies on a refined set of commercial indicators. Directors don't need a fifty-slide deck; they need the "Big Four." These are Customer Acquisition Cost (CAC), Customer Lifetime Value (LTV), Marketing-Sourced Revenue, and Return on Marketing Investment (ROMI). These metrics act as bridges between your creative strategy and the company's financial stability. By focusing on these high-level outputs, you transform marketing from a discretionary expense into a predictable revenue driver.
Marketing-sourced revenue remains the ultimate proof of departmental value. It moves the conversation from "how much did we spend?" to "how much did we earn?". While Return on Ad Spend (ROAS) is a useful tactical indicator for channel optimization, the board prioritizes ROMI. ROMI accounts for the total investment, including technology and headcount, providing a transparent view of marketing's contribution to the enterprise's bottom line. This shift in perspective replaces the anxiety of manual reporting with the confidence of a streamlined, high-level perspective.
Efficiency Metrics: CAC and Payback Periods
Your CAC must be fully loaded to gain CFO approval. It's not just your ad spend; it's the cost of your tech stack, overheads, and personnel. For sales-led B2B SaaS, the median CAC reached $11,400 in 2026, marking a 9% increase since 2024. The board tracks the "Time to Payback" metric religiously because it directly impacts cash flow. If your payback period exceeds twelve months, it suggests your growth strategy might be straining the company's liquidity. Benchmarking your efficiency against these 2026 industry standards ensures your reporting remains grounded in commercial reality.
Growth Metrics: LTV and Pipeline Contribution
Growth is measured by the quality of the future, not just the success of the past. A healthy LTV:CAC ratio is 3:1 or higher. You can use advanced predictive modelling to forecast these values with precision, showing the board that your strategy ensures long-term stability. Marketing's share of the sales pipeline is equally vital. With the median MQL to closed-won rate sitting at 2.4% in 2026, improving lead velocity is a primary growth lever. Mastering these numbers allows you to transition from reactive reporting to strategic mastery. For those seeking deeper clarity, implementing Performance Marketing Analytics can turn these complex data points into actionable growth recommendations.
Beyond Last-Click: Proving Real Value with Multi-Touch Attribution
Last-click attribution is dead. In our complex, multi-device world, relying on the final touchpoint is a recipe for miscalculated ROI and wasted budget. Fragmented data across platforms creates blind spots that lead to expensive mistakes. When you're presenting marketing kpis to the board, you must explain that the "Walled Gardens" of big tech platforms often grade their own homework. They claim credit for every conversion while ignoring the influence of other channels. This lack of transparency hides the true drivers of your growth.
The board demands commercial clarity. They want to know exactly which investments are moving the needle. By moving toward Multi-Touch Attribution (MTA), you identify the "hidden" growth drivers that a last-click model simply misses. This transition replaces the anxiety of fragmented data with the confidence of a streamlined, high-level perspective. It allows you to transform passive data points into active participants in your business strategy, proving exactly how marketing generates long-term value.
The Flaw in Linear Attribution
Linear and last-click models are inherently biased. They over-value search and direct traffic while under-valuing the brand awareness that started the fire. By using sophisticated marketing attribution, you tell the full story of the customer journey. This shifts the narrative from guesswork to precision. Multi-touch attribution is the map of modern influence. It provides the transparency needed to justify every pound spent on top-of-funnel activity, ensuring your strategy is seen as a cognitive upgrade for the entire organization.
Proving Incrementality
Incrementality is the board's favorite word. It answers a critical question: "Would this sale have happened anyway?" You must separate organic conversions from those truly driven by your marketing spend. Proving incrementality shows the board that you aren't just claiming credit for existing demand but are actively creating new revenue. When you present incremental lift, you provide a concrete weight to your budget requests. This level of detail allows you to justify a budget increase with absolute transparency, shifting the conversation from cost management to predictive growth.
Constructing the Narrative: A Step-by-Step Guide to Your Board Deck
Lead with the numbers that keep the board awake at night. Your board deck is a strategic asset, not just a collection of slides. When you are presenting marketing kpis to the board, your first slide must address revenue and profit. Directors demand commercial clarity immediately. Don't hide your impact on slide twenty; prove your value within the first sixty seconds. This approach replaces the anxiety of manual reporting with the confidence of a streamlined, high-level perspective.
Transparency builds trust. Implement a Red, Amber, Green (RAG) status for your major campaigns to provide instant campaign transparency. This system allows you to celebrate wins while showing the board you have a firm grip on underperforming areas. It shifts the conversation from defensive explanation to collaborative problem-solving. By the time you reach the end of your deck, the board should view you as a pragmatic partner obsessed with measurable returns.
Visualising Complexity for Non-Marketers
Visualising complexity requires choosing the right tools for the job. Waterfall charts beat pie charts every time when explaining revenue growth. They show the step-by-step journey from investment to return, making the transition from complexity to growth feel inevitable. You must simplify the customer journey without losing strategic depth. Aim to create a "Single Source of Truth" dashboard that directors can access between meetings. This removes ambiguity and positions your department as the organization's most transparent growth engine.
Predictive Forecasting: Looking Forward, Not Backward
Stop reporting on what happened and start predicting what will happen. The board is interested in the future. Move the narrative from historical data to "What will happen if we spend £X?". Present three distinct scenarios: Conservative, Target, and Aggressive growth. This allows directors to choose their risk appetite based on your data-driven projections. Utilizing ai marketing analytics removes the guesswork from forecasting, ensuring your predictions are tethered to concrete business outcomes. End your presentation with a specific growth recommendation rather than a passive summary. If you are ready to upgrade your boardroom presence, explore how Automated Reporting can transform your fragmented data into a compelling narrative of success.
Automating Boardroom Clarity: How Nodal AI Elevates Performance
The Nodal Platform transforms fragmented marketing data into the high-level financial insights your directors actually demand. Manual data collection is a drain on your productivity and your authority. By the time you finish your quarterly deck, the numbers are often already obsolete. Our automated reporting eliminates this lag, saving marketing leaders over 20 hours of preparation time per board cycle. This efficiency allows you to focus on strategic mastery rather than spreadsheet management. When you're presenting marketing kpis to the board, you need to replace the anxiety of manual labor with the confidence of real-time, verified data.
Predictive modelling acts as your "unfair advantage" during high-stakes budget negotiations. Instead of defending last month's spend, you can model future returns with machine-learning precision. This shifts the boardroom dynamic from a cost-center critique to a growth-engine investment. Real-time multi-touch attribution ensures you can answer specific director questions on the fly with absolute transparency. You no longer have to promise to "get back to them" with a number; you can show them the live impact of your strategy on the P&L. This level of commercial clarity turns passive assets into active participants in the business process.
AI-Powered Growth Recommendations
Nodal AI identifies emerging trends before they even register in standard reports. It turns raw, disconnected data into actionable intelligence, allowing for faster commercial decisions. By providing the board with growth recommendations backed by machine learning, you move beyond simple reporting. You become a visionary leader who anticipates market shifts rather than just reacting to them. This cognitive upgrade for your organization ensures that every marketing asset is optimized for maximum return, replacing guesswork with data-driven certainty.
The Nodal Advantage: London-Based Enterprise Expertise
As a London-based enterprise partner, we understand the rigorous data governance needs of complex global organizations. Our team configures custom dashboards tailored to your specific C-suite requirements, ensuring total clarity for every stakeholder. We help you map the entire customer journey to prove exactly which channels drive revenue. This level of sophisticated performance marketing analytics replaces manual complexity with streamlined growth. Discover how Nodal AI can transform your executive reporting and secure your strategic seat at the table with the confidence of an expert.
Command the Room with Commercial Clarity
You've moved from the anxiety of vanity metrics to the confidence of financial mastery. By focusing on the "Big Four" and embracing multi-touch attribution, you transform marketing from a cost centre into a growth engine. Presenting marketing kpis to the board is no longer a defensive task; it's an opportunity to lead. You've seen how a structured narrative and predictive scenarios can align your strategy with the organisation's long-term stability. This shift replaces manual, tedious tasks with the high-level perspective directors actually demand.
Stop wasting 20+ hours on manual spreadsheets and start delivering high-value outputs. The Nodal Platform provides the AI-powered multi-touch attribution and predictive growth recommendations you need to secure budget approval. With our London-based technical onboarding, your transition from fragmented data to total clarity is seamless and professional. Book a demo of the Nodal Platform to automate your boardroom reporting today. It's time to claim your seat at the table as a strategic partner in predictive growth. Your next board meeting is the perfect moment to show them what marketing can truly achieve.
Frequently Asked Questions
What are the most important marketing KPIs to present to the board?
The most critical metrics for presenting marketing kpis to the board are those directly tied to enterprise value. Focus on Customer Acquisition Cost (CAC), Customer Lifetime Value (LTV), and Marketing-Sourced Revenue. These indicators prove that marketing is a growth engine rather than a cost centre. They provide the commercial clarity directors need to make high-level financial decisions.
How do I explain Customer Acquisition Cost (CAC) to a non-marketing board?
Explain CAC as the fully-loaded commercial investment required to win a single new customer. It's the total sum of media spend, technology costs, and personnel divided by new acquisitions. Directors care about this because it determines your "Time to Payback." A clear CAC figure shows you understand the relationship between capital investment and customer growth.
Can AI-driven predictive modelling really forecast marketing ROI?
AI-driven predictive modelling transforms historical data into future growth probabilities with remarkable precision. It identifies patterns that human analysis might miss, allowing you to forecast ROI with high confidence. This technology removes the guesswork from budget requests. It enables you to present scenarios that show exactly how specific investments will impact the bottom line over the next twelve months.
What happens if our marketing attribution data is currently broken or fragmented?
Fragmented data erodes executive trust and leads to wasted budget. You can resolve this by using a centralised platform to unify disparate sources into a single source of truth. Automated reporting tools bypass the manual errors inherent in spreadsheets. When you are presenting marketing kpis to the board, having verified data is the only way to maintain your strategic authority.
How often should I present marketing performance to the board of directors?
Deep strategic reviews should occur quarterly to align with your company's financial reporting cycles. However, providing the board with real-time dashboard access is increasingly standard in 2026. This transparency allows directors to monitor progress between formal meetings. It shifts your role from a reactive reporter to a proactive and highly capable strategic partner.
What is the difference between ROAS and ROMI in executive reporting?
ROAS measures the revenue generated specifically from your ad spend, making it a tactical tool for channel optimisation. ROMI is a broader financial metric that accounts for your total marketing investment, including headcount and software. While ROAS is useful for the marketing team, the board prioritises ROMI. It provides a more transparent view of the department's actual contribution to company profitability.
Is multi-touch attribution necessary for a Series A board presentation?
Series A boards look for evidence of a scalable and efficient growth machine. Multi-touch attribution is essential here because it proves you understand the entire customer journey. It shows that your growth isn't accidental. Implementing this level of performance marketing analytics early signals strategic maturity and ensures you're investing capital into the most effective touchpoints.
How can I prove marketing incrementality to a skeptical CFO?
Prove incrementality by showing the revenue that would not have existed without your specific marketing interventions. Use sophisticated incrementality modelling to separate organic demand from marketing-driven conversions. This level of detail satisfies even the most skeptical CFO. It provides a concrete weight to your claims and justifies your requests for budget increases.


