

A low blended CAC can hide an expensive acquisition engine. If you’re working out how to calculate blended cac, the formula is simple: divide the acquisition costs you’ve included by the number of new customers acquired in the same period. The challenge is defining those costs and customers consistently, particularly when marketing, booking and customer data sit in separate systems.
Blended CAC gives you a portfolio-level view, not a verdict on any one channel. A strong overall figure might be influenced by organic or referral customers even if paid acquisition remains costly. Channel-level CAC and attribution add useful context, but they answer different questions. Use them to investigate the headline number, not as proof of what caused a result.
This guide explains which costs and customers to include, how to set a consistent reporting period and how to make the calculation repeatable. You’ll also learn how to interpret blended CAC alongside channel performance and the customer journey. Start with a clear overall measure, then use connected marketing data to understand what may be driving it and make more informed investment decisions.
Key Takeaways
- Learn how to calculate blended cac with a repeatable process that starts by setting a reporting period and defining a new customer.
- Choose which acquisition costs to include, then apply that scope consistently so you can compare results over time.
- Understand what blended, channel-level and attributed CAC each reveal, and where each measure has limits.
- Align customer and cost data to the same period, and account for reporting delays before interpreting the result.
- Use changes in blended CAC as a prompt to investigate channel and customer-journey detail, not as proof of what caused them.
What blended CAC measures, and what the number can tell you
Blended customer acquisition cost (CAC) is the acquisition expenditure included in a defined period divided by the number of new customers acquired during that same period. It combines activity across the channels in your chosen scope rather than assigning each customer to one source. The result is an average of how much you spent to acquire a new customer.
That average is meaningful only when its boundaries are clear. State which costs count, what qualifies as a new customer and which dates the calculation covers. For example, don’t mix first-time bookers with returning customers in the new-customer count. If you change the definition or reporting window between periods, the movement in CAC could reflect the method rather than a genuine change in acquisition efficiency.
CAC measures acquisition expenditure per new customer, not the revenue those customers generate. It is distinct from customer lifetime value (LTV), which estimates the value a customer brings over time, and return on ad spend (ROAS), which compares revenue attributed to advertising with advertising expenditure. You can consider CAC alongside LTV to assess customer economics, but CAC alone does not reveal profitability or advertising returns. The Customer Acquisition Cost (CAC) overview on Wikipedia provides further context on the metric and its relationship with customer lifetime value.
How blended CAC differs from channel-level CAC
Blended CAC combines the relevant acquisition channels into one overall measure. Channel-level CAC isolates a defined source or campaign so you can examine its acquisition cost separately. The measures answer different questions: blended CAC indicates overall efficiency across the included activity, while channel CAC shows how a particular channel’s costs and customer count compare under your definitions.
Neither measure automatically proves which channel caused a customer to convert. Blended CAC does not assign individual customers to sources, and a channel figure depends on how you define that source and allocate its costs. Use the measures together, and treat attribution as a separate way to examine customer journeys.
When blended CAC is useful, and where it can mislead
When calculated consistently, blended CAC gives teams a concise top-line measure to monitor over time. It can flag a change in overall acquisition efficiency and provide a shared starting point for discussion. It cannot diagnose the reason for that change on its own.
Channel mix matters. If channel costs stay steady but a larger share of new customers comes through a lower-cost channel, blended CAC may fall. If the mix shifts towards a more expensive channel, it may rise. The average can also conceal differences in customer value, conversion delays and channel economics. A lower blended CAC is not automatically better if the customers acquired bring less value or take longer to convert. Knowing how to calculate blended cac is only the first step: interpret the result alongside channel detail and customer outcomes.
How to calculate blended CAC: formula, costs, and customer count
To calculate blended CAC, divide the acquisition costs you’ve chosen to include by the number of new customers acquired during the same period. The arithmetic is straightforward. The important work is setting clear rules for both sides of the equation before comparing results.
Blended CAC = included acquisition costs ÷ new customers acquired
For example, imagine a business records £12,000 in acquisition costs during one quarter and counts 120 newly acquired customers in that quarter. Its illustrative blended CAC is £100 per new customer. These figures are hypothetical, not an industry benchmark. If the costs cover one quarter but the customer count covers a different period, the result won’t be a like-for-like measure.
Which costs belong in the calculation?
Set a written cost policy that matches the question you want CAC to answer. You might include paid media and other direct acquisition costs, then decide whether to include agency fees—such as retainers for partners like MM Digital Tech Marketing—staff salaries, creative production and marketing technology. There is no universal scope for every analysis. Document what you include, exclude and allocate, then apply that policy consistently.
Keep costs unrelated to acquiring customers out of the calculation. For shared expenses, such as a tool used by several teams or staff time supporting multiple activities, record how you assign a portion to acquisition. Avoid changing allocation methods between periods without flagging the change. Otherwise, a change in the reported figure could reflect a new accounting choice rather than a shift in acquisition performance.
How to define the customers in the denominator
Count newly acquired customers, not the total customer base or repeat purchases. Define the event that makes someone a customer, such as their first completed purchase, and set rules for merging duplicate records. Apply those rules across every reporting period so one person is not counted more than once.
In hospitality, a booking is not always the same as a new customer. One guest may make multiple bookings, and one booking may include multiple guests. Decide whether your analysis counts new guests, customers or another outcome, and label it clearly. If you count bookings, call the result cost per booking, not CAC.
Before publishing the figure, check that cost records and customer counts use the same dates, currency and organisational scope. If costs are shared across locations or business units, document the allocation. This keeps the result interpretable and makes later comparisons more useful.
Disconnected advertising, booking and customer records can make these definitions harder to apply consistently. Bringing marketing and commercial data together can help you compare the inputs. Explore connected marketing analytics features to see how connected data can support clearer acquisition measurement.
Does blended CAC hide channel performance? Compare the right measures
Yes, it can. Blended CAC is useful for seeing acquisition efficiency across a portfolio, but it cannot diagnose the efficiency of an individual channel. A lower average might reflect a change in the mix of customers and channels, not improved performance across every part of the marketing programme.
Blended CAC is an aggregate efficiency measure, not a diagnosis of channel performance. Read it alongside channel-level and attributed measures, and be clear about what each one can and cannot tell you.
Blended CAC
Purpose: Summarises acquisition costs across the channels in scope.
Limitation: Does not show which channels contributed to the result or explain the efficiency of each one.
Channel CAC
Purpose: Shows acquisition cost for a defined channel or campaign, based on the customer and cost rules you set.
Limitation: Results depend on consistent channel definitions and may not capture the full path to conversion.
Attributed CAC
Purpose: Connects acquisition costs to customers credited to a channel under a chosen attribution model.
Limitation: The model distributes credit according to its rules. It does not prove that a channel caused the conversion.
Read blended CAC alongside channel and customer value
Compare the blended trend with channel-level trends before drawing conclusions. If the overall figure changes while channel CACs remain steady, the channel mix may have shifted. If one channel’s measure moves, investigate its costs, customer volume and conversion pattern rather than treating the blended average as a channel ranking.
Where the data supports it, segment by market, property, customer type or acquisition period to uncover differences an overall figure can smooth over. Pair CAC with a relevant customer value measure, such as revenue over a defined period, but keep the measures distinct. Acquisition cost describes what it took to acquire customers; value describes what those customers generate under your chosen definition.
Account for attribution and customer journey limits
A customer may interact with several channels before converting. An attribution model assigns credit across those interactions according to a chosen framework, but that allocation is not causal proof. Tracking gaps, delayed conversions and cross-device behaviour can also leave parts of the journey unobserved or make it harder to connect interactions to a customer.
Choose an attribution approach that fits the question, document its rules and use the same approach when comparing periods. A marketing attribution framework can help clarify how credit is assigned. To understand how customers move between discovery, consideration and conversion, use customer journey mapping as added context. Knowing how to calculate blended cac gives you the overall signal; these additional views help you investigate what may sit behind it.
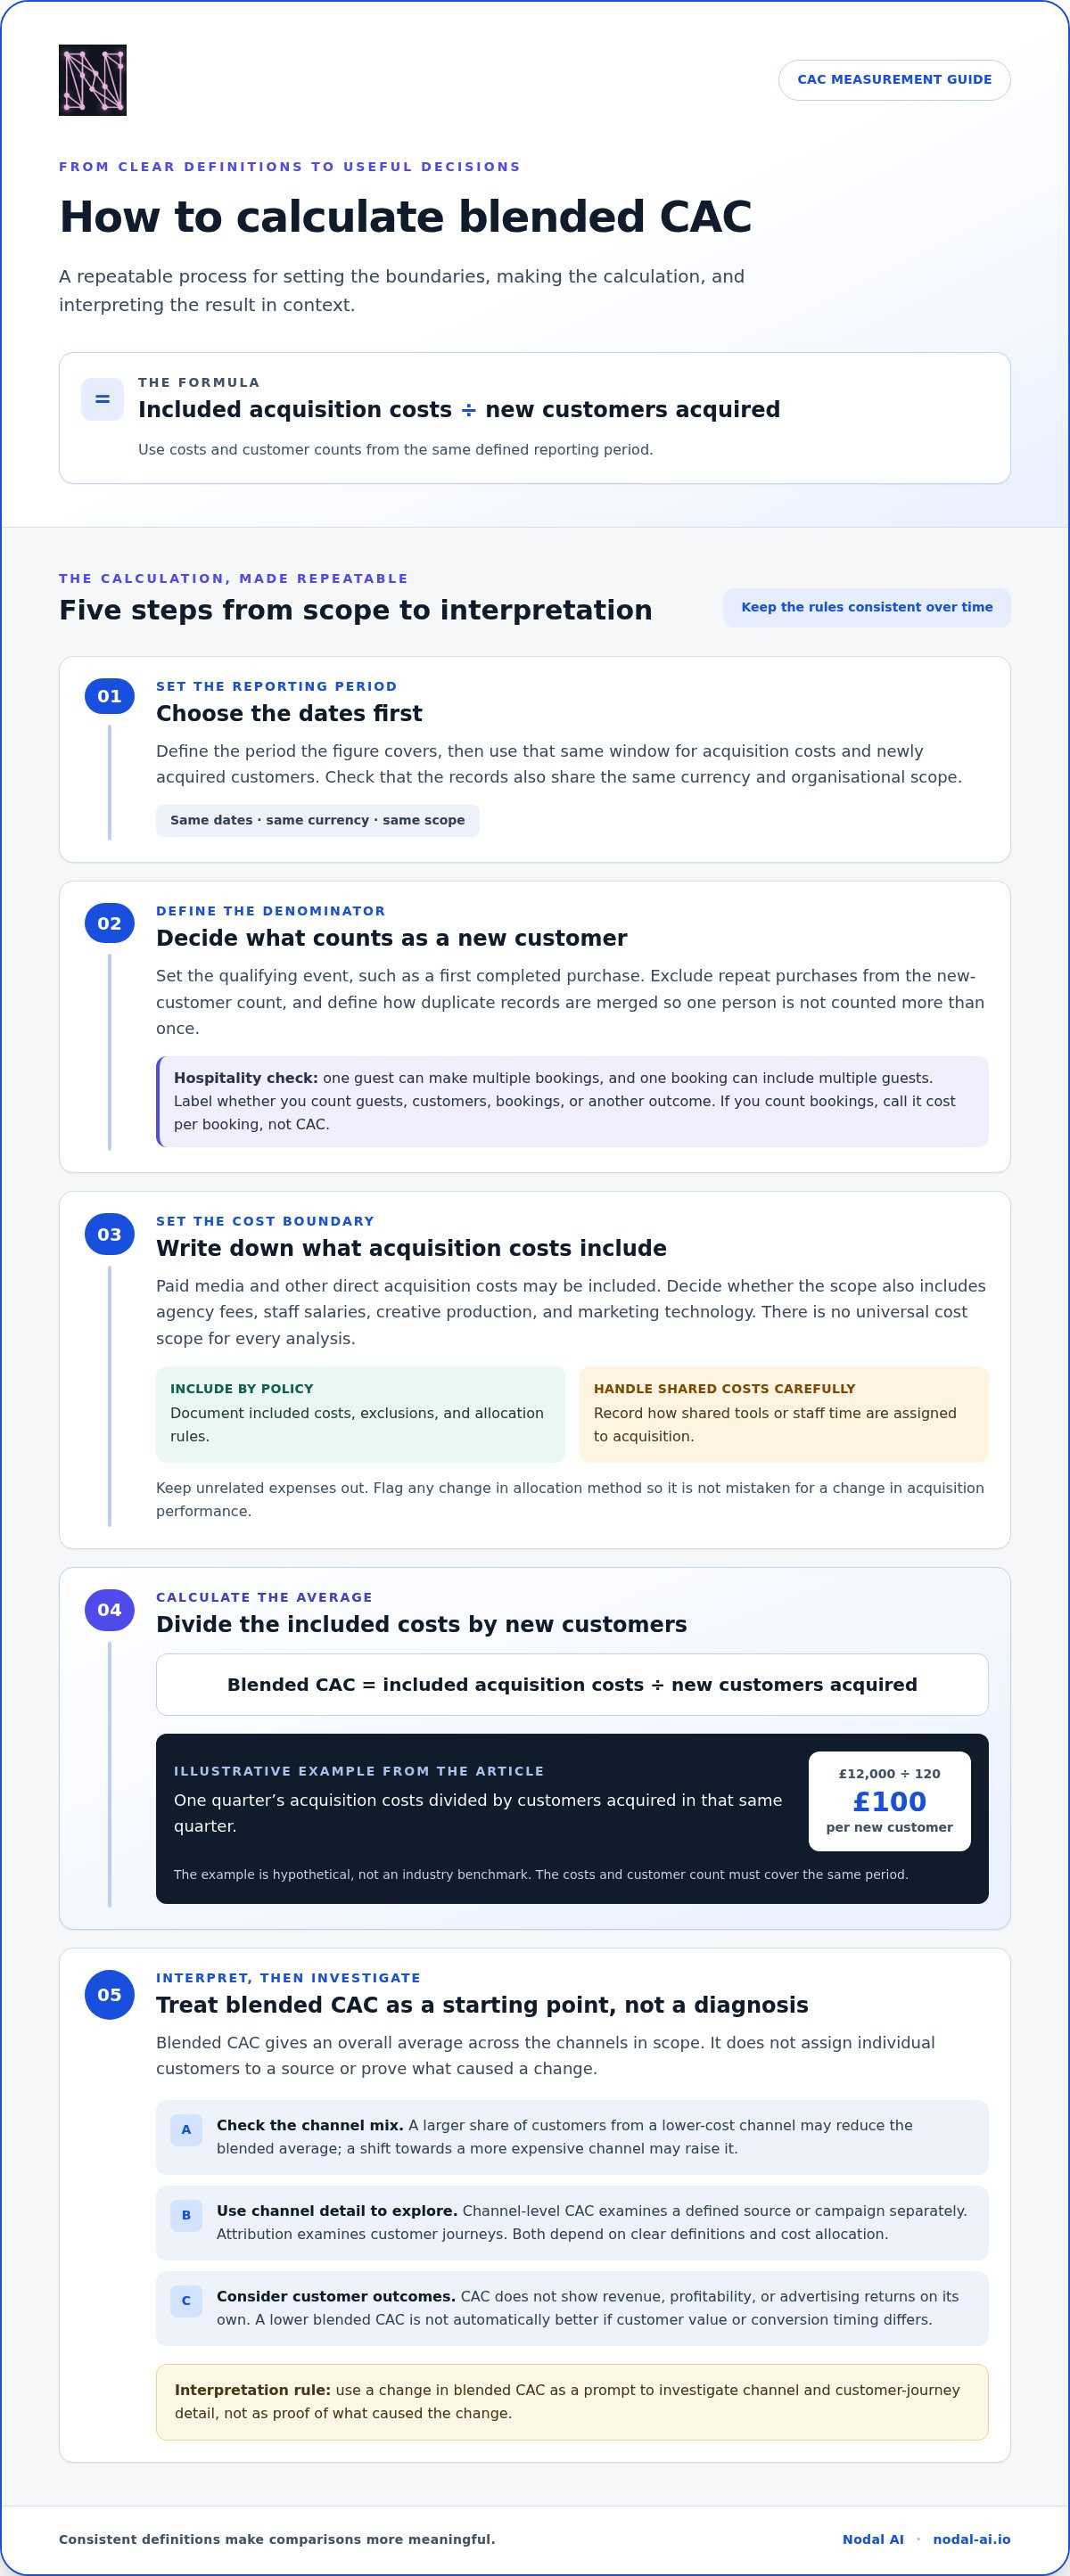
How to calculate blended CAC step by step and make it repeatable
A reliable calculation is a repeatable process, not a one-off spreadsheet exercise. Set the rules first, reconcile the inputs, then record how you arrived at the result. That makes it easier to compare periods without mistaking a change in measurement for a change in performance.
- Set the reporting period. Choose a clear window, such as a calendar month or quarter, and use the same dates for spend and new-customer counts.
- Define a new customer. Decide which event marks acquisition, such as a first completed booking or purchase, and how duplicate records will be handled.
- Agree the cost scope. Document which acquisition expenses are included and how shared costs are allocated.
- Collect and reconcile the data. Bring together spend records and customer counts, then check that channels and customers are represented consistently.
- Calculate blended CAC. Divide the included acquisition costs by the new customers counted for the chosen period.
- Interpret and record the result. Note the assumptions, exclusions and any reporting delays beside the figure before comparing it with another period.
Illustrative example: Assume a business includes £18,000 in acquisition costs for a quarter and records 150 newly acquired customers in that same quarter. The calculation is £18,000 ÷ 150, giving an illustrative blended CAC of £120 per customer. These hypothetical figures demonstrate the arithmetic only. If some bookings are still being matched to customer records, mark the count as provisional and update it consistently once the records are reconciled.
Build a reliable input set
Gather channel spend reports, invoices for included costs, and customer or booking records from the systems that hold them, such as advertising platforms, a CRM and a booking system. Before calculating, look for duplicated customers, missing channels, refunds that affect your defined acquisition outcome, and campaign names that differ across reports. Keep an audit trail with data owners, date ranges, definitions and exclusions. A data governance framework can support clearer ownership and shared definitions.
Compare periods without creating false conclusions
Compare equivalent windows and flag seasonality or material shifts in channel mix. Comparing a quarter with the same quarter in another year may offer useful context, while mismatched periods can produce a misleading signal. Record what changed, then separate the observed movement in CAC from its possible causes. The calculation alone cannot establish why performance moved or prove that a particular activity caused the change.
Store the period, customer definition, cost scope, source data and any lag or adjustment beside every result. Keep the method stable where possible. If you change an assumption, label the break in the series so readers can distinguish a methodological change from a genuine movement. This discipline turns a quick calculation into a measure your team can revisit and interpret with confidence.
Turn blended CAC into clearer acquisition decisions with connected data
A blended CAC result is a starting signal, not a decision by itself. Turn it into a practical review routine: monitor the trend, inspect channel detail, then investigate material changes before adjusting investment. If the figure moves, check whether spend, customer volume, channel mix, booking patterns or reporting completeness changed. This helps separate what the data shows from what you still need to investigate.
- Monitor the trend: compare consistently defined periods and note unusual movements.
- Inspect channel detail: identify which channels or campaigns contributed to the overall picture.
- Investigate changes: check customer and commercial data before deciding what action to take.
Fragmented systems can make that review difficult. Advertising platforms may record spend and clicks, booking systems hold reservation activity, CRMs store customer records, and analytics tools capture digital interactions. If these sources use inconsistent campaign names, dates or customer identifiers, it may be hard to match acquisition activity to outcomes. A connected view can make the inputs easier to compare, but it cannot remove every tracking gap or prove that a particular channel caused a booking.
When analytics support is useful
Analytics support is useful when teams need channel, customer and commercial information in a shared view rather than in disconnected reports. Nodal Platform connects disparate data to support commercial, customer and operational insights. Its Nodal Platform features provide context for interpreting acquisition performance, while customer journey mapping and multi-touch attribution help examine how interactions appear across the path to conversion. Treat these as analytical perspectives, not guarantees of causal certainty.
For example, an attributed report may show that several interactions received credit before a booking. That can help frame questions about the journey, while blended CAC keeps the overall acquisition measure in view. Neither tells the whole story alone. Compare them, check the underlying definitions, and use the evidence to guide further analysis rather than assuming an attribution model identifies the single cause of a result.
Move from calculation to a considered next step
Keep the routine grounded: document customer and cost definitions, calculate consistently, then investigate channel detail when the trend changes. Joined-up performance data can reduce the effort of assembling reports and add useful context, especially when marketing and booking records sit in separate systems. The aim is not to chase a lower number at any cost, but to make investment decisions with a clearer view of acquisition and customer outcomes.
Nodal AI reports client case-study outcomes for Ovolo Hotels, including a 15.3% reduction in acquisition costs and a 24.5% increase in ROAS. These are reported case results, not a blended CAC result or a promise of what another organisation will achieve. Your measurement definitions, data and business context shape the findings.
Book a Nodal AI demo to discuss how connected marketing performance data could support your acquisition reporting.
Make your next acquisition review a stronger decision point
Use your next CAC review to move from reporting to a decision you can evaluate. Before shifting budget, write down the question you want to answer, the expected signal and the customer outcome that would matter. Then compare the result with your established baseline and record what changed. This creates a learning loop rather than treating one movement in blended CAC as a mandate to scale or cut spend. Over time, a clear record can help your team recognise which assumptions hold and which need revisiting.
The practical value of knowing how to calculate blended cac is not the number alone. It is the clarity it brings to the next question and the evidence you gather before acting. Keep your approach consistent, make each decision traceable, and use what you learn to shape more informed investment choices as your marketing evolves.
Every measured decision is a chance to learn and move forward with greater confidence.
Frequently Asked Questions
Is blended CAC the same as customer acquisition cost?
Blended CAC is a form of customer acquisition cost that combines acquisition activity across the channels included in your calculation. The underlying metric is still the cost of acquiring a customer, but “blended” signals that you’re looking at an overall average rather than a single channel. Check the label in reports: different teams may use different cost scopes, so the same term can refer to calculations that are not directly comparable.
Can blended CAC be lower than paid CAC?
Yes. Blended CAC can be lower than paid CAC if the overall customer count includes acquisitions from channels with lower measured costs, such as organic or referral activity. Paid campaigns may have a higher cost per acquired customer than the business-wide average once other sources are included. That does not mean paid activity is ineffective. Compare the measures using consistent periods and customer definitions before interpreting the difference.
Should salaries and software costs be included in blended CAC?
Include them if your chosen measure is intended to capture those acquisition costs, and explain how you calculate any allocated share. For instance, if a marketing platform supports several teams, you might assign only the portion your policy attributes to acquisition. A narrower calculation may focus on direct costs instead. Neither approach is meaningful without a clear label, so record the scope and keep it stable for comparisons.
How often should a business calculate blended CAC?
Set a cadence that matches how quickly you need to make decisions and how long customers typically take to convert. A monthly view can help teams monitor current activity, while a less frequent review may make more sense if customer numbers are low or conversions take longer to register. Whichever cadence you choose, compare equivalent periods and allow for reporting delays before treating a movement as a reliable trend.
What happens if marketing costs and customer counts use different time periods?
The calculation can be misleading because the costs and customers no longer describe the same acquisition window. For example, a campaign’s spend may appear in one month while customers who converted after a longer consideration period are counted later. Align the reporting periods where possible. If conversion lag prevents that, label the result as provisional or explain the matching method, then update comparisons consistently.
How do you calculate blended CAC for a hotel?
Choose the hotel’s acquisition costs and divide them by the number of newly acquired guests, using the same reporting window. Decide whether acquisition means a first completed stay, a confirmed reservation or another clearly defined event. These choices produce different measures. Reconcile booking and customer records so repeat stays are not mistaken for new guests, and state how cancellations or duplicate profiles are handled.
Does blended CAC show which marketing channel is most profitable?
No. Blended CAC gives an overall acquisition cost, not channel profitability. To assess a channel, compare its acquisition costs with the revenue or customer value associated with customers attributed to it, using clear definitions. Attribution can help organise credit across customer interactions, but it does not prove a channel caused a conversion. Knowing how to calculate blended CAC gives you an overall reference point, not a channel-by-channel profit verdict.


